Creating a Gantt in Excel - Basic

Вставка
- Опубліковано 23 жов 2016
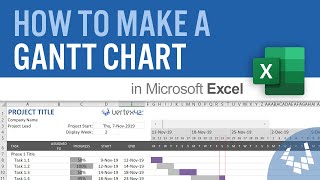
- I want to post a quick video on creating a Gantt Chart in Excel. As an example, professionals , managers or project controls may not have access to a scheduling software. However, their could be a need to create an executive Level 1 or Level 2 schedule. This method allows for the Gantt to be somewhat dynamic for purposes of updating.
Advanced Planning Analytics
www.advancedplanninganalytics...
Project Analytics iPhone App
appsto.re/us/tEPWjb.i
Project Analytics Android App
play.google.com/store/apps/de...
Follow Cesar:
Instagram: / cesar.ramos2019
Twitter: / advancedcpm
LinkedIn: / cesar-ramos-91186818
Facebook: / p6professional


Thanks so much. This was very helpful and super easy to follow.
Appreciate video content! Forgive me for the intrusion, I would appreciate your opinion. Have you considered - Weydaniel Organized Dominator (erm, check it on google should be there)? It is a great one off product for getting 7000 plus project management and business templates minus the headache. Ive heard some super things about it and my work buddy finally got amazing success with it.
Excellent video. Learned a lot from you, TQ
Thanks , I prepared it in one go !
thanks a lot, was very helpful for me at this moment,
this is truly brilliant, I can't fathom all this. I really need the basics to start....
Lori Favela ua-cam.com/video/0-KNbULStNg/v-deo.html Check this...it might b helpful too...
Navneet Dwivedi c
Cheers for the video content! Sorry for chiming in, I would love your opinion. Have you heard about - Weydaniel Organized Dominator (Sure I saw it on Google)? It is a great one of a kind guide for getting 7000 plus project management and business templates minus the normal expense. Ive heard some super things about it and my old buddy Taylor got astronomical success with it.
Great....Very helpfull for projects tracking
Clever Excel Tutorial. Thanks
Thank you very much! Very big help! :D
Fantastic ! Thumps Up bro.
Thank you so much. This is very helpful
thanks so much. you made my work so easy
Wow that cumulative percentage line is such a nice complement!
It was a last minute add but does seem to complement
YOU HELPED! THANKS!
ohh this was really good for my personal planning
this is so helpful..ty so much
Thanks for making it simple
Thank you, very helpful.
Great work
Most Excellent
From the activities, looks like you're a process engineer, also me too. And this is what I looking for since I have develop my engineering schedule
This is real good
Do you know how I'd be able to change the color of one of the bars halfway, so that one color represents it was one way for some time and another way for later time?
nice very informative
Very nice tutorial. I'm trying to align the vertical text to the Left but I don't see how, is there a way? Thanks.
hey so im on that part where im about to change it to line chart and my 2016
excel seem to have a different kind of line chart. please help me!!
this is great! thanks a lot! However, when tried to change the graph type for the "% Cum" series didn't work for me, it turned just one line (followed all the steps) - any clue why that might be? Thank you!
thanks for sharing..this is absolutely a great stuff...can we add as well the actual status on this?
Yes. It takes another couple of steps but I'll post another video showing how to make progress bars work.
This is the progress bars
ua-cam.com/video/NVRp_28LQgM/v-deo.html
Thanksss
Hey Carlos, no doubt you know that critical path tasks cannot overlap
Hey there! Nice video. Is there a way to include predecessors for a task?
Hypothetically, you can show it but this is only Excel so it doesn't show dependencies in the chart unless you purposely show it
can this be replicated with Excel Online?
Honestly, I haven't tried it yet
Good
how can we add milestones if we need to.
Nidhi, there is a way but the way to make the chart is a bit more confusing and with more steps involved. If there is enough interest I'll post a video on how to make that happen.
That would be great. thank you!
www.advancedplanninganalytics.com/excel-gantt-using-vba.html
Advanced Planning Analytics ś
Hi when i execute the secondary data it shows the line but it completely hides the rest of the primary data. Using excel 2016. Can you help me please.
You need to be sure the primary & secondary are different chart types
Hi, I tried but it did not work for me either. I am using Excel 2013
ua-cam.com/video/0-KNbULStNg/v-deo.html
ua-cam.com/video/4jWqFH5Hzd4/v-deo.html Check this...it might b helpful too...
there are activities that are happening simultaneously, wont it affect the projection of the s-curve? You just added the values and plotted it in sequence. Should we add the values with the same time just like what he did on his video(ua-cam.com/video/nazqFo0OqVg/v-deo.html)? IM JUST CONFUSED. THANKS
hi pane