thank you so much! nobody at the math tutoring department of my uni could tell me how to do this. they just said "you just gotta figure it out" how am i going to have the time to manually draw two parabolas in a 2 hour calc test ? thanks again!
Thank you for this video it’s been a while since talking calculus and using a Texas instrument calculator. I purchased the TI-84 Plus from another video, but I like the color from yours it helps make learning interesting especially when relearning the calculator with its added features and written work refresher.
Man i have seen like 5 of these types of video's and No one has mentioned about how to enter a function equation after running a regression and then getting a graph. Like i know how to enter it manually but that just takes to much time. Its much quicker if you run a regression and add that function to your regression so you can plot your graph.
I want to fire so many teachers in this country. How can they force us to buy this expensive device not knowing how to use it. They even never ever use it for their course.


Thank you so much. I haven’t used calculator in a while and I’m taking calc for online school. This just refreshed all my memories!!!
THANK YOU! I was having so many issues with graphing on the calculator but thanks to you I know how to graph on it.
thank you so much! nobody at the math tutoring department of my uni could tell me how to do this. they just said "you just gotta figure it out" how am i going to have the time to manually draw two parabolas in a 2 hour calc test ? thanks again!
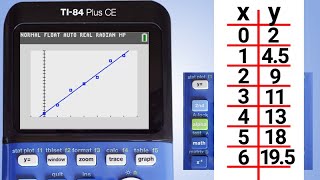
Plug in all the x values and trace
@@namaste_1236 yup, i didn't know that
I know I'm a junior in high school and it was killing me. Everyone knew how to do this but me.
I can always help!
Thank you much man, I lost the instructions so this is a big blessing.
Thank you!! I have a graphing calculator quiz coming up and i needed this!!
A decade later and this is still helpful!
Got it!! Good stuff; it’ll get me started enjoying my old TI-84+!!
This helped me so much cause nobody would help me figure out why nothing was graphing correctly.
Thank you for this video it’s been a while since talking calculus and using a Texas instrument calculator. I purchased the TI-84 Plus from another video, but I like the color from yours it helps make learning interesting especially when relearning the calculator with its added features and written work refresher.
thanks so much! this will be so useful for my precalc class :)
Does anyone know if he uploaded videos demonstrating examples of the other types of functions: polar, parametric, and seq?
bro you come in clutch for me.
Thank you , I was having problem with finding zeroes for my maths 2 subject test. Super helpful
This was super helpful, thank you!
So how do I get rid of the X , Y when I see my graph. Like I only want to see the graph not the X and Y on the right side .
how do u move the graph around? i cant see the full line
Came in handy. Thank you!
Thanx for this helpful videos
What if my second line/curve doesn’t work
so damn mad. why does it either say syntax error or says the range is too great?
Can we find maxima and minima of the equations we input ?? I need it desperately for SAT
Yeah, press window
I'm a teacher and wondering what is the name of the software you are using to display this to students?
I think you can search ti-84 emulator then download one
Thank you sir!!!
hi, how will you graph if there Y in it for example 3x + 4y = 12
You solve for y and graph y = (12 -3x) / 4
When I press y+ they are all "r" instead of "y", wtf?
go to "Mode" and change the 4th option to "FUNC" or "Function"
It won't let me have a negative and a positive equation a the same time "syntax error", I really need the calculator to do this
Same :/
Thanks for this
Thanks for the help
Great video and very helpful. Thanks
OMG VERY HELPFULL THANK YOU!!
watching this 30 mins before a national exam
Wait did you pass?
@@iisajudge5671 so uh.... No
Thank you so much
Thnx Sir !!!!!! May God bless you 😀
Thanks a lot!!
THANK YOU
thx for the help :)
Man i have seen like 5 of these types of video's and No one has mentioned about how to enter a function equation after running a regression and then getting a graph. Like i know how to enter it manually but that just takes to much time. Its much quicker if you run a regression and add that function to your regression so you can plot your graph.
I want to fire so many teachers in this country. How can they force us to buy this expensive device not knowing how to use it. They even never ever use it for their course.
thank you sooo much :)
thank you
Thankyou!!!
Tysm my math teacher doesnt teach us properly and tmrw is my exam so i had to study by myself😭
thanks!!
THANK U
Thx
Just saying, I have 0Y to 9Y
Thanks man!
POV: Algebra 2
This is cool