Thanks for this tip. Can we have an additional conditional formatting on the bar, e.g., if below 25% then color is red, between 26% and 75% color yellow and above 75% color is green?
Maybe try combining the data bar option with the ‘formatting based on formula’ option if excel allows it. That way you could use IF functions to apply different colours to different data ranges, but I have a suspicion data bars can’t be applied to formulae.
Yes, you can probably do that by adding additional conditions. I’ve done it with numbers not the bars. You can change the color of the text based on the percentage you’ve selected
Is it possible to fill the cell from another cell? ie. I have data and would like for it to automatically update the percentage across the year. Great video.
1. Make a representation of dynamic progression: brand, track (injections and human health), prospect (procedures and health), adaptability (alkaloids and health) 2. Health's Triptych: injections and human health, procedures and health, alkaloids and health 3. Formating cells can be useful
Good Info, is there any way to mark border with color once its reverse from high, my point is suppose its Live number movement and one progress reach to 90 and return to 70 so in this case I need to know it was touch to 90 and now running at 70. So this reversal I can see through color image ?
Great tutorial. Short and very informative! Question if I have column with different values and I want to find max value of that column (it is simple), but how to implement that code in format there I need to right number, but I have the code? I hope that makes sense.
Hi can we have different color based on different status, if I change the status to progress color should be blue fill, if status is complete should be green


Excellent video, clear explanation, and to the point - thank you much PK !
Most welcome
Explained so simple way..Amazing Thanks
Most welcome
Yep - I concur - got me what I needed - much faster and simpler than other online help. Thank you!
I have been trying to figure this out all day , this video was super helpful and to the point! Well Done !
Thank's a lot.
From Indonesia
Most welcome
Yes brother it is useful for me.....Thank so much, I really appreciate.....👏
Thanks for your valuable feedback🙏
Thank You from Indonesia, it is very helpfull
Thanks for your valuable feedback
Perfect, thank you very much
You are welcome!
Very informative tutorial PK. Thanks a lot
Most welcome🙏
Super Thanks. Very useful.
Amazing videos - I am a Analyst and I have learnt alot fro your videos eveytine
Thanks for your valuable feedback
PK: An Excel Expert can u do a hr dashboard, productwise sales dashboard and attrition analysis
Thankyou so much.
Thanks PK for the usual support and sharing your experience and knowledge.
Thanks for your valuable feedback
Great.. Thankyou very much
Most welcome
Great video, I like that you go directly to the point, thank you!
Glad it was helpful!
You're a blessing. Thank you
Most welcome🙏
thank you man, this is awesome!
Most welcome🙏
brilliant and simple- thank you
Most welcome🙏
This was great! Thanks!
Most welcome🙏
Thanks for your perfect explanation
Glad it was helpful!
Thank you, this is very helpful
Thanks🙏
Thank you! this is exactly what I was looking for
Glad it was helpful!
Great explanation, thanks a lot PK!
Thanks for your valuable feedback
Thank you, excellent video short and to the point.
Thanks for your valuable feedback
Thanks for sharing sir.God bless😇
Most welcome🙏
Awesome tutorial! Thanks!
Thanks for your valuable feedback
Thankio to show us your Professional simple Methodes and i am really really impress to learns to behave my Currier in the work place. Jj
WOW!!! What a great feature! Thanks so much!
Thanks for your valuable feedback
Beautiful and easy to follow… keep it up
Thanks a lot 😊
Thank you, this was very helpful and straight to the point.
Thanks for your valuable feedback.
Thanks, that was helpful
Glad to hear it!
You are legendary
Thanks a lot🙏
Nicely explained concept. Was very useful
Thanks for your valuable feedback
Such a great video. Thank you! This was exactly what I was looking for and you explained it perfectly.
Thanks for your valuable feedback
Thank you 🙏
Most welcome
Thank you. I was looking for that.
Thanks for your valuable feedback
Just what I was looking for, excellent!
Thanks for your valuable feedback
thank you! this help me a lot on making my progress report love it
Glad it helped!
exactly what i needed, thanks man!
Glad I could help!
Thank you so much! very well explained !! :)
You are welcome!
SO SO helpful, thank you!
Thanks for your valuable feedback
Superb video, thank you so much
Most welcome
Thanks for the help!
Most welcome
thank you it was very helpful
Thanks for your valuable feedback
Thank you very much for this great video and for this extensive explanation, thank you very much.
Thanks for your valuable feedback
Great video, I like that you go directly to the point, thank you!
Thanks for your valuable feedback
Great video. Thank you.
Glad you liked it!
Thank You soo much!
Most welcome🙏
Short and effective. Thank you for such a great video
Thanks ☺️
Most welcome
Thank you!!!!!!!!!!!!!!!!!!!!
Most welcome
Simple n useful, thanks PK ji
Thanks for your valuable feedback
Thank you!!
You're welcome!
Thank you so much
You're most welcome
Very useful video thanks sir
Most welcome
Many thanks for sharing
My pleasure
This is excellent, thank you
Thanks for your valuable feedback
Dude great video, you have a subscriber now :)
Thanks for your valuable feedback
Totally dude this can keep you motivated.
thanks, you saved me!
Thanks for your valuable feedback
Thanks, that was useful for me
Thanks for your valuable feedback
Excellent Sir ! Thanks for the beauty.
Thanks for Thanks for your valuable
EXcellent topic. Thanks .
Thanks for your valuable feedback
Thanks for this tip. Can we have an additional conditional formatting on the bar, e.g., if below 25% then color is red, between 26% and 75% color yellow and above 75% color is green?
Maybe try combining the data bar option with the ‘formatting based on formula’ option if excel allows it. That way you could use IF functions to apply different colours to different data ranges, but I have a suspicion data bars can’t be applied to formulae.
Yes, you can probably do that by adding additional conditions. I’ve done it with numbers not the bars. You can change the color of the text based on the percentage you’ve selected
Thanks
Most welcome
Well done
Thanks for your valuable feedback
Is there a way to plot only between percentages? For example, I need to plot only between 10%-90% leaving white spaces at both ends
Great suggestion! I will try to create a video on this topic.
Yes very helpful! Thanks! Now subscribed to your informativr channel. Thanks a mil!
Thanks for your valuable feedback
Thanks a lot. how can we copy this into Microsoft word ? I copied it as a picture into Microsoft Word. Can we copy it as an editable table in word?
Is it possible to fill the cell from another cell? ie. I have data and would like for it to automatically update the percentage across the year. Great video.
Yes, you can conditional format cells using data from a separate cell
Hi sir good information, how to paste in an outlook with a data bar needed in table format not in pic format plz help me
Thanks homie!
Most welcome
Very helpful thanks.
Thanks for your valuable feedback
Thanks! This is really helpful! :)
Thanks for your valuable feedback
Thanks for the video Partner.
Thanks for watching
Thanks for the video! Made my life so much easier! 5*****
I love this! How can I remove the dropdown arrow. It is visible when I printed it.
Me encanta pero lo que más me gusta de tu trabajo son las gráficas que realizas
This was very helpful. Thank you 😊
1. Make a representation of dynamic progression: brand, track (injections and human health), prospect (procedures and health), adaptability (alkaloids and health)
2. Health's Triptych: injections and human health, procedures and health, alkaloids and health
3. Formating cells can be useful
Excellent thanks
Thanks for your valuable feedback
Very useful. Can we make vertical bars?
Thank you!!!!!!!!
Welcome
thank you bro
Most welcome🙏
It really works. However, the bar is not coming as dynamic. is there a specific reason?
thnx sir
Most welcome
can you please tell this format in Mac OS??
Sir nice,, make one video for icons with different examples sir
1:49 how did you create these tools and put them in the Ribbon. Is it done using VBA or how. I am just curious. Thank you
Solid fill not available in my excel
How to down load pc utility tool
Good Info, is there any way to mark border with color once its reverse from high, my point is suppose its Live number movement and one progress reach to 90 and return to 70 so in this case I need to know it was touch to 90 and now running at 70. So this reversal I can see through color image ?
thank you
Most welcome
Very nice sir
Thanks for your valuable feedback
Great tutorial. Short and very informative! Question if I have column with different values and I want to find max value of that column (it is simple), but how to implement that code in format there I need to right number, but I have the code? I hope that makes sense.
How to make this in google sheet?
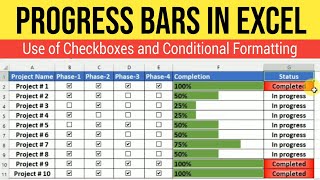
Hi can we have different color based on different status, if I change the status to progress color should be blue fill, if status is complete should be green
Is this also possible in google spreadsheets? Thanks!
Thanks it helped a lot. How to change the colors based on percentage?
How come in progress is 100%?
Thanks sir ,
Could you please make video on speed up excel calculation
Sir is there any formula for it