Multicolor Filling Bars in Excel Cells Without using Chart

Вставка
- Опубліковано 15 сер 2020
- #DynamicDataBar #Visulaization
Hello Friends,
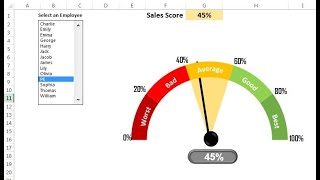
In this video you will learn how to create Multicolor Filling Bars in Excel Cells without using Chart. You can use such visualization to display the project completion status with red color for delayed and green color for on time. Or you can use this trick to show the service level or Quality score with Red, Amber, and Green color with filling bars.
Download the practice file from below given link:
www.pk-anexcelexpert.com/mult...
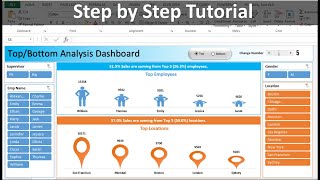
Download the Free Project Management Dashboard
www.pk-anexcelexpert.com/exce...
Download our free Excel utility Tool and improve your productivity:
www.pk-anexcelexpert.com/prod...
See our Excel Products:
www.pk-anexcelexpert.com/prod...
Visit to learn more:
Chart and Visualizations: www.pk-anexcelexpert.com/cate...
VBA Course: www.pk-anexcelexpert.com/vba/
Download useful Templates: www.pk-anexcelexpert.com/cate...
Dashboards: www.pk-anexcelexpert.com/exce...
Watch the best info-graphics and dynamic charts from below link:
• Dynamic Graphs
Learn and free download best excel Dashboard template:
• Excel Dashboards
Learn Step by Step VBA:
• VBA Tutorial
Website:
WWW.PK-AnExcelExpert.com
Facebook:
/ pkanexcelexpert
Telegram:
t.me/joinchat/AAAAAE2OnviiEk5...
Pinterest:
/ pkanexcelexpert
Visit our Amazon Store
www.amazon.in/shop/pkanexcele...


Thank you for the trick PK. Once again you showed me a new and better way of doing things. Thank you!
Any Service Level Manager would love this. Thanks, great work! 👍
Thanks for your valuable feedback
Brilliant job. All the detail needed and still concise.
Thanks for your valuable feedback🙏
Thank you for Sharing! Just what I was looking for!
Thanks for your valuable feedback
It's very smart to use backward white to have at the same time a progress bar and a value based color ! Thanks :-)
Thanks for your valuable feedback
really a very good tutorial. well made, clear and not boring. bravo!
Thanks for your valuable feedback🙏
Exceptional tutorial. Exactly what I needed
Thank you very much!
Nice. A good revision of conditional formate also done
Thanks a lot Professor
Nice and effective! Thanks Pk
Thanks for your valuable feedback
Thank you for this excellent video!
You're very welcome!
fantastic sir, Thanks
You are a star !
Thanks a lot.
God bless you PK, I've been looking for this one exactly the one as in "Service Level" data sheet, I just didn't know how to phrase my question :(
Thanks a lot man!
Thanks for your valuable feedback
Great content and excellent explanation PK Sir. Thank you very much.
Thanks for your valuable feedback🙏
Nice approach, thank you for sharing, Best regards
Thanks for your valuable feedback
Wow, amazing , thank you.
Thanks for your valuable feedback
Great work!
Thank you! Cheers!
Excelente maestro
Thanks for your valuable feedback
Thanks for sharing, very useful:)
Thanks for your valuable feedback
Thank you Sir... For conditional formatting process....
Thanks for your valuable feedback
Awesome, good, thanks.👍
Thanks for your valuable feedback
Excellent, thank you.
You are welcome!
Thank you this was very helpful
Glad it was helpful!
Wow you are very clever!
Thanks🙏
Thank you so much my GURU ..
Most welcome
thank you extremely helpful
Thanks for your valuable feedback
Thank You Sir....Very Nice Video
Thanks for your valuable feedback
Amazing Thank you
Most welcome🙏
very nice helpful video Thank you
Most welcome
Wonderful sir
Thanks for your valuable feedback
Thanks 👍
Most welcome🙏
Very good tutorial
Thanks for your valuable feedback
Your videos are always very insightful. Thanks for sharing
Thanks for your valuable feedback
Good Job, I just wished there was a way to get rid of annoying colored border around the white bars.
Thank you
Welcome
Wow nice sir i understood i will use it but sire can you teach us forecasting manpower calculation scheduling WFM part please sir please
You are great sir., sir one question you can write comment sir... how you think to do excellent idea pls
Great content; question. With the first example, can you make the remaining of the data bar a different color? For instance if it is 75% on time, it will be filled green 3/4 of the cell. Can you color the remaining 1/4 of the cell a different color?
Very good pk...
Please also start tutorial on power BI and DAX
Thanks for your valuable feedback. Will upload soon
Sir thank you for the Lesson and permission to download practice file. Appreciated very much
Thanks for your valuable feedback
Great. Please start on python and pandas library.. to atomate the excel report. Really we need it. And your teaching skill is awsome. Please please please start your videos on python
Thanks for your valuable feedback. I will try.
Very good info PK..But I have told you already that you have to zoom in while typing or selecting options so that viewers can see it clearly what you're doing. It will easy to understand & practiced clearly
Thanks for your valuable feedback. I will take care of this in upcoming videos
Good pk
Thanks for your valuable feedback
Dear sir I requested to you that please make a video about the power bi. I want want to learn from your video.
What would you do if you also have to include negative percentages in your data bar?
Thanx
Welcome
❤
Thanks 🙏
👍👍👍👍👍
Thanks
ms access form data entry tutorial
Start sir very interested your teaching thanks sir
Please watch the below given videos-
ua-cam.com/video/4WXzPROcjLE/v-deo.html
ua-cam.com/video/aYJatDiNswQ/v-deo.html
V nice video... V useful...can u create a dashboard sla scorecard based on the requirements like ABN rate, ASA, FCR, CSAT AND OTHER PARAMETERS
Please refer the below given playlist.
ua-cam.com/play/PLbDvAYjpWJ7CpupRYMRkXSN0L92t7nUuF.html
thank you very much really beneficial,
could we remove the remaining borders of cell fill color
because bar is slightly smaller than cell hieght making part of cell background appears
Yes we can
Sir , insentive sheet excel की बनानी है ।
Can anyone help with a macro how to write formula based on column header and fill down till last used row..
Specially when formulas are written in separate sheet say
sheet1 as all the formulas and sheet name( Col a = headers, col b= formula)
Sheet 2 has headers in row 1, in horizontal, macro should look sheet1 and list the formula in sheet 2 once the headers matches and has to fill till last used row
Unsure how to do that
Si si teclado está en español y no les funciona con And, deben poner Y
I have taken single data and have highlighted with colors, but when i add data bars .. it disappears 100 percent and showing red bar bigger..
I want to show progress with status only. Like if I select completed then bar should show 100% if in progress then it should be 50% and pending should be 25% not started 0%
Sir...How to Use....Pk's Utility Version 1.0 & 2.0 in Win-7,MS Off-2010....am using MS Off 2010...am Add in version 1.0..still it is not working in my system...??? Same for 2.0 also....Pls....give me Solutions for those problems..???
This doesn’t work for me. The white bar fills the cell based off the %. For example, if the cell was 30%, the white bar would fill the cell up 30% of the way instead of 70%. Any fixes for this issue ?
Same for me i dont understand please help!
Hello
PK, let me know if u need anything from Ghana
God bless you
Hello Sir i would like to get in touch with for an assignment, i have also mailed you and messaged you in telegram, waiting for your kind response
?????
Thank you
Most welcome
?????