Applied this technique in my today's MIS, it's awesome, Was not able to download Playbill font due to system restrictions. But found Nyala font which will also give similar bar. It's a preloaded windows font. Thanks for the video ...
This is an ingegenious trick. It solved my problem. Saw here a couple of other tutorials who have copied this idea as their own. I know yours is original because it's the oldest one. Thank you.
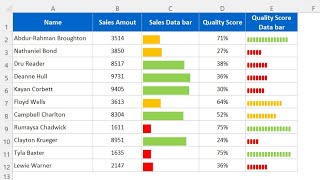
Hi Alan.. this is a super tip.. love it! Thanks for the reference to Playbill font.. I've locked that one into my brain. Also, the conditional formatting trick is a great idea. I used MIN and MAX to produce the highlights. On the star chart.. here is a tip I discovered: =UNICHAR(9733) will show a black star regardless of the font designation of the cell. You can't use UNICHAR() in REPT, but you can F9+ENTER it into a cell and then copy and paste it between quotes in REPT as in: =REPT("★",ROUND(H5,0)). In this way, no font change is needed to display the star. Other UNICHAR codes could be used, as well. Thanks again.. really love these tips.. super useful and will be using them right away in my work. Thumbs up!!
@@christopherlawes6081 Hi Christopher.. you are indeed correct. I think when I tried I forgot to input the number_times argument of REPT(text, number_times) and so got an error. Nice to know another way to do it. Thanks for the tip. Thumbs up!
Great Vid again! For my numbers I like dividing by a certain number so the pseudo chart fits into the cell column width. Like =REPT("|",B2/7). The bigger the divisor the smaller the pseudo chart
@@brightdaysaheadofUs The "pipe" symbol, which is mentioned too in the video, plus what font (Playbill) allows display with super tight kerning so it looks like a solid bar.
7:00 I would set the REPT() text to a highlighted cell that is absolutely referenced so that I can change the character used by changing what’s in the referenced cell, rather than editing the function itself. If you want to take it a bit further, make a list of characters and reference it for a drop down list above the chart column.
Absolutely fantastic!!! I wasn't able to use playfill I didn't have that. I used min+10&cell for the fill so I could see the end result There is suppose to be a site I can download it, Thanks computer Gaga
When I changed the font to "playbill" the bar doesn't look as a solid bar rather gap is visible in between the "I". Any suggestions plz? It is really fruitful
Thank you Bashar. I don't know how, or why you want it applied to a time cell. But the time is a fraction of a day so 12:00 is 0.5. We could multiple this value by 10 or 100 to create a bar or icon significant enough to chart.
For sure, but you would need a symbol that is half a star. In this video, I'm using full-star symbols, so no. But with half-star or quarter-start symbols, you can adapt the formula to show the appropriate symbol/star. It definitely could be done.
Thank you Igor. The cool thing here is that we can add the automatic colour change of the bars on any criteria we want. The Conditional Formatting data bars do not offer that functionality.
Hello, thank you for sharing, I found this very useful, I was trying to use the function but I found out that I do not have the same font that you are using, playbill, i believe is the one. I tried to download it from the web but it seems its not working on my mac fonts. Is there any other font that I can use or other way to make it work? Thanks
Hi! I'm Trying to get the Nearest Sum from the Target using Excel Solver, For Example, i have Shipments A to D that holds a value, what i want to get is the combination of all the shipments based on the target Value which is 200, in this case, the constraint is not met because there are no way to get the value of 200 if we sum the shipments, what i want to get is the Nearest sum from the target, in this case. 155, the result will be (Shipments - A,B,D), is there a way we can get the nearest sum of combination using Excel solver? A - 50 B - 50 C - 50 D - 55 Thank you so much!
What formula can use pl. Reply In row 1,,, digit is 783 now what formula can use for this ..... 7+8+3=18 now if total is 12 or 6 then ture and if not 12 or 6 than false
I'm not sure Robert. Will need to pay around with some other fonts and see what looks good. See if there are alternatives to Playbill that look good. Ensure the font is bold also.
This apparently only works for small numbers. I tried for numbers greater than 50,000 and i got #VALUE error messages for all of them. When I changed to the small numbers in this video, it worked.
It is typically referred to as the pipe symbol. You can probably Google the location for your keyboard. On my keyboard it is between my left Shift key and the Z.


Applied this technique in my today's MIS, it's awesome, Was not able to download Playbill font due to system restrictions. But found Nyala font which will also give similar bar. It's a preloaded windows font.
Thanks for the video ...
Awesome!! Thank you for the suggestion. A few people have commented about other possible fonts.
Thanks for the how to use the REPT function. just what I needed to help break away from the traditional bar charts.
My pleasure.
This is an ingegenious trick. It solved my problem. Saw here a couple of other tutorials who have copied this idea as their own. I know yours is original because it's the oldest one. Thank you.
Thank you 😊
Hi Alan.. this is a super tip.. love it! Thanks for the reference to Playbill font.. I've locked that one into my brain. Also, the conditional formatting trick is a great idea. I used MIN and MAX to produce the highlights. On the star chart.. here is a tip I discovered: =UNICHAR(9733) will show a black star regardless of the font designation of the cell. You can't use UNICHAR() in REPT, but you can F9+ENTER it into a cell and then copy and paste it between quotes in REPT as in: =REPT("★",ROUND(H5,0)). In this way, no font change is needed to display the star. Other UNICHAR codes could be used, as well. Thanks again.. really love these tips.. super useful and will be using them right away in my work. Thumbs up!!
Thank you Wayne. And great tips, thank you.
I found I could use unichar in rept "=REPT(UNICHAR(9733),REF)". Maybe version specific? I'm using Excel 2016. Thanks
@@christopherlawes6081 Hi Christopher.. you are indeed correct. I think when I tried I forgot to input the number_times argument of REPT(text, number_times) and so got an error. Nice to know another way to do it. Thanks for the tip. Thumbs up!
Whoa! I feel like I can do so much more with this visual. Thanks so much for sharing.
You're very welcome. Thank you George.
Wow, that was awesome! Wasn't even looking at Excel today, just stumbled over this.
Lol, same.
Thank you Lomax.
Great Vid again! For my numbers I like dividing by a certain number so the pseudo chart fits into the cell column width. Like =REPT("|",B2/7). The bigger the divisor the smaller the pseudo chart
Thank you RickK. Sounds like a good idea especially for large values.
Whats the letter inside the quotation mark?
@@brightdaysaheadofUs The "pipe" symbol, which is mentioned too in the video, plus what font (Playbill) allows display with super tight kerning so it looks like a solid bar.
7:00 I would set the REPT() text to a highlighted cell that is absolutely referenced so that I can change the character used by changing what’s in the referenced cell, rather than editing the function itself.
If you want to take it a bit further, make a list of characters and reference it for a drop down list above the chart column.
I m blown away by this...this was very amazing and useful. This is so simple but yet I couldn't have ever imagined this was possible in excel
Awesome!! Thank you Suyash.
This is called creativity. Loved it !
Thank you very much Sakib.
Thanks! Much easier and customizable options compared to existing conditional formatting..
Absolutely Hafiz.
that was powerful!!!....thank you very.....going to make some improvement right away!!!
Thank you very much Samuel.
This is very useful to standout in making daily office worksheets. The content of your videos are understandable.
I appreciate your efforts.
Thank you Mohit.
Very nice. Thanks for sharing
You're very welcome.
Really useful. Thanks a bundle!
My pleasure Erica. Thank you.
It is very relaxing and educational listening to you. Never thought such a combination would even exist. :)
You're very kind. Thank you.
thank you it was very helpful
Great to hear 👍 You're welcome, George.
Sir, superb technique 👍🏻💐
But, after open inverted commas how to type this symbol
Thank you! I copied the star symbol from cell J3 into the quotes. Because of the font, it is displayed as
Amazing technique. Something new! Thank you for sharing this technique with us.
You're welcome. Thank you Siddharth.
such a good explanation, thank you so much, definitely you are an excellent teacher
Thank you very much 👍
Wow, awesome technique. Thanks a lot for sharing this
You're very welcome.
Thank you so much! Your video saved me so much!
Excellent! You're welcome Shad.
It is really great, Thank you
You're welcome. Thank you.
New for me, thanks I will use it in my future reports and resume
You're welcome.
Thanks for sharing. I appreciate your time in this video.
My pleasure Mark.
Thank you very much
You're welcome. Thank you for watching.
Wow...this is absolutely brilliant....sir...you are amazing. Thank you so much for the video
You're very welcome Anand. Thank you.
Trucs very utils & exclusif s.. Bravoooo teacher
Very simple and very useful, thanks a lot 👍
You're very welcome. Thank you James.
Excellent
Thank you Majid.
Sir, this will be very useful for me.......................thanks in tons.
You're welcome Munaf. Thank you.
Very creative Alan, nice one 😉
Thank you Paula.
Excellent video. Many thanks
Thank you Sir Corn.
Thanks @Computergaga,
Question: how do i change the color of the stars based on the value
You can use Conditional Formatting like I do with the bars at 03:28 but with the criteria you desire for the stars.
Great video!
but can you make that 3.5 represents 3 and a half of a star??
Thank you. If you can find the icon/symbol/emoji then you can show anything for any criteria.
Very Informative!! Thank you, sir!
You're very welcome.
Absolutely fantastic!!!
I wasn't able to use playfill I didn't have that.
I used min+10&cell for the fill so I could see the end result
There is suppose to be a site I can download it,
Thanks computer Gaga
Thank you. Yes there are sites where you can download fonts. The Stencil font works also.
Excellent video and very informative.
Thank you Scott.
Thank you, very helpful.
Thank you Stefan.
You can do the first one by simply using data bars from conditional formatting
You sure can, but you cannot add the Conditional Formatting extra that we did in the video.
Just superb! Thanks!
Thank you Chris.
Useful as usual, and I still live your accent !
Thank you.
Respect. Wow wow wow.. 🌟 🌟
That is powerful.. 🌟 🌟 🌟 Thanks Alan. 👍
You're very welcome Salim.
Wow Sir Great
Thank you very much.
Brilliant!!! Thank you!!💚
You're welcome. Thank you.
For the star, you can use use the star in the unicode instead
Excellent. Thank you.
Very cool! Thank you
You're very welcome Nicolae. Thank you.
Such a cool idea
Thank you Minh Vuong Luu.
Thank you for sharing sir, Appreciated
My pleasure. Thank you Abu.
This is great, is the bar graph target automated to be 💯 with this method ? Please advise, thank
Awesome!
Thank you 😊
Thank You!
You're welcome.
Perfect and thanks again
You're very welcome.
Very informative 👍
Thank you very much Chandra.
What if the score has negative values?
Afternoon.
Kindly assist Plainbill does not change the to chart.
Not sure why this is. Try experimenting with other fonts, but the font is the font, it should work the same.
Excellent mind blowing Sir. Great
Thank you Afzal.
Fantastic, thanks for this 👍
You're very welcome Tahir.
Great video thanks
You're welcome Laith.
When I changed the font to "playbill" the bar doesn't look as a solid bar rather gap is visible in between the "I". Any suggestions plz? It is really fruitful
very use ful video thanks
My pleasure.
Excellent function.. and a smart tip.. how can it be applied to a time cell?
Thank you Bashar. I don't know how, or why you want it applied to a time cell. But the time is a fraction of a day so 12:00 is 0.5. We could multiple this value by 10 or 100 to create a bar or icon significant enough to chart.
cool trick, thanks for this
You're welcome. Thank you.
Thank you.
You're very welcome Sani.
Super! Grazie mille! But what about Microsoft Excell Online? It has very few fonts 😥😥
Thank you. Ah we may need a different technique with the online with the fonts don't render correctly. There may be an alternative though.
@@Computergaga I menaged to did it. Just clicked "open with excell in desktop" and than... ta-daaa LOL thank you!
I wish I'd have found this site earlier in my life instead of having to carry around that unwieldy Abacus
😂 Happy to help.
Nice, thanks.
Thank you Luciano.
Hi, Rept function for in cell chart giving error if there is involvement of negative values...
Yes, the REPT function only handles positive values.
How can you use this for example monthly trending ? So for the score example where you have month 1 score and then month 2 scores
Just Great video
Thank you.
Nice tip
Thank you Robert.
Is the 3.55 ,exactly can show 3.5 stars ,is it possible without rounding to 4 stars
For sure, but you would need a symbol that is half a star. In this video, I'm using full-star symbols, so no. But with half-star or quarter-start symbols, you can adapt the formula to show the appropriate symbol/star. It definitely could be done.
How do i make change to the bar value? my biggest value is 5 . but the bar look so small
With the REPT function, multiply the number by a large number i.e. 10. So the value is still 5, but the bar charts 50.
Do it for each bar.
its not working i apply =rept(''|'', and the cel num but its not wrking
I want to graph the change in a cell value , please help
Hi Tanuj, can you be more specific? You can reach out to me via email.
5:58 for star part
Under wich excel version does that works
This will work under any version.
Can't we use sparkline today to do this?
Some of it, yes you are right. They cannot be customised in the way that we added the conditional colouring to the bars though.
How!!! wonderful
Thank you Romesh.
I do not find the sign "l" after rept...please help
The sign is called the pipe. On my keyboard it is above the \. It may be somewhere else on yours.
Awesome. Is there a way to use the IF statement and join other symbols (“”&””) to add a half star or quarter etc to make the visual more accurate?
Sure. If you can find symbols for these, you can use any symbol and formula to construct the visual.
Nice one. You can do it also with conditional formating with Bar option. Much faster and simple.
Thank you Igor. The cool thing here is that we can add the automatic colour change of the bars on any criteria we want. The Conditional Formatting data bars do not offer that functionality.
@@Computergaga I realized that and that's why I liked this one. Very useful especially with reasonable numbers. Thank you 👌
Thanks sir
You're welcome Hariprasanth.
Hello, thank you for sharing, I found this very useful, I was trying to use the function but I found out that I do not have the same font that you are using, playbill, i believe is the one. I tried to download it from the web but it seems its not working on my mac fonts. Is there any other font that I can use or other way to make it work? Thanks
Thank you. There is the Stencil font too.
you have got an amazing brain🧠🧠🧠
Thank you very much 😊
@@Computergaga its my pleasure sir
Pls mention excel version too so i can practice
Hi Saptarshi, this video is done using Excel 365 Pro, but the techniques shown can be done on any version.
Very good. Someone is burning the midnight oil with Excel.
Living the dream 😊
Creative and useful. 😊
One question, please: is there a way to get partial stars for the second chart (i.e. rounding 3.55 to 3.6 instead of 4)?
Thank you Bianca. Not sure on the partial stars unless there are emojis showing that detail.
Seems to be a limitation. One way round it is to multiply data to whole numbers and plot them e.g 3, 3.55, 3.8 becomes (x100) 300, 355, 380.
@@christopherlawes6081 That's a creative solution. 😊
keep it up
Will do. Thank you Mohamad.
Where is the pipe in the keyboard, please help im not finding here
On a UK keyboard it is on the same key as the backslash. Different language keyboards can position characters in different positions though.
You are an Excel version of Bob Ross.
NICE ! but what if the other guys don't have that playbill font?
Thank you. Other fonts can also be used. You can play around with this.
You can use Nyala instead. It's a preloaded font
Can we use half star as well for 1.5 or 2.5
Sure, if you can find a half star icon to use in the REPT function.
Hi!
I'm Trying to get the Nearest Sum from the Target using Excel Solver, For Example, i have Shipments A to D that holds a value, what i want to get is the combination of all the shipments based on the target Value which is 200, in this case, the constraint is not met because there are no way to get the value of 200 if we sum the shipments, what i want to get is the Nearest sum from the target, in this case. 155, the result will be (Shipments - A,B,D), is there a way we can get the nearest sum of combination using Excel solver?
A - 50
B - 50
C - 50
D - 55
Thank you so much!
What formula can use pl. Reply
In row 1,,, digit is 783 now what formula can use for this .....
7+8+3=18 now if total is 12 or 6 then ture and if not 12 or 6 than false
Is there another font I can use. I would like to do this in google drive. I have been looking for something like this.
I'm not sure Robert. Will need to pay around with some other fonts and see what looks good. See if there are alternatives to Playbill that look good. Ensure the font is bold also.
Best I could find was install "Zilla Slab Highlight" and using text such as "-" (hyphen)
This table represents what values?
Whatever you want them to represent.
love the accent
Thank you Ibrahem.
This apparently only works for small numbers. I tried for numbers greater than 50,000 and i got #VALUE error messages for all of them. When I changed to the small numbers in this video, it worked.
Sure. A solution to this could be to reduce the number for the visual by dividing them by a number. For example, =REPT("|",B2/1000)
Computergaga Thanks!
I did not find this sign in my keyboard,what is name of the symbol
It is typically referred to as the pipe symbol. You can probably Google the location for your keyboard. On my keyboard it is between my left Shift key and the Z.
@@Computergaga thanks