With your video populated on one monitor, i was working in another monitor to create what my Boss requested me to do and i've done it with success and pride, all because of you. Thank You again, my friend.
i was hesitant to watch another excel dashboard like youtube video but honestly you really did a tremendous job explaining and showing what you did thank you so much!
very clear and concise information and very easy to understand, I feel this is something I could do now, so many tutorials seem to be too quick, but I picked this up a lot more easily with the clear, relaxed voice and explanations - thank you.
Thank You very much Nabil, You are awesome. I had been trying to learn the Pivot Tables and Slicers and no was able to teach me cos I am such a thick skull. :) but you 26.28 minutes or video was extremely engaging and clearly defining each and everything that I now understand how to work with Pivot Tables and design the reports my boss has been asking for :) Thanks Very Much, Only Allah can reward you for such a great teaching,
Greetings from Indonesia. Really enjoy learning from Your tutorial. The step by step process are well explained and makes it easy to follow. Thank You!
This tutorial is amazingly good. I learned a lot from it and it gave me some inspiration for my classes (I give Excel classes to students). Thank you so much! Fan +1 😊
using equal in cell text box will only work if =GetPivot function is off. If you don't want to off it then you'll need to create a helper-identical column of Sales Revenue
First of all I would like to than you for awesome presentation. In this tutorial I'm unable change series chart type since custom combination is not available to select secondary axis. Note:- I am doing this on Excel 2007
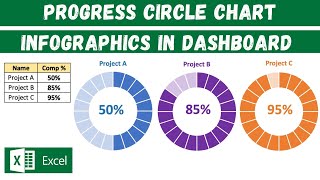
I thoroughly enjoyed your tutorial! Thanks so much. I did want to inquire though if you could explain the intent of how the helper column impacts the progress doughnut chart? Why exactly was that necessary (the '=1' equates to 100% is what I figured) but how does that actually interplay into the chart in the interactivity part?
minute 11:30 , it shows a secondary axis which 39% is the actual sale ( the actual part that will be seen) and 61% the transparent which is the leftover, non sale
Cool. I've just used this in one of my dashboards. One problem I've run into is that for certain filter combinations some of the rows have no output (the value is zero) so Excel hides it which means that the doughnuts pick up the wrong row. I had to use the field settings to make sure it shopws row with no data. By the eay, what version of Excel are you usign there? At work I have to use Excel 2010 because of compatibility with vertical applications, that doesn't let you do the secondary axis. On my personal machine I have Office 365 Pro Plus (Semi-Annual channel) which does but I noticed that some of the settign look different. If I create the dashboar don my personal machien it still works in 2010 on my work machine. Thanks.
In this case you have to make sure that all Seller ( for example) have done some sales on all regions so you can insert a data for all seller for all regions with 0 amount. So even if the seller did not sell for an specific region it would appear as 0. That is how I resolved here.
Thank you for the nice comment. Kindly share my tutorials to your social media... You can download the start file by going to my website www,OfficeInstructor.ca and click on "Downloads"
Very nice and helpful for a beginner like us. No idea who all dislike this tutor.. anyway m very much happy and definitely try with my project with this formula 👍👍👍


With your video populated on one monitor, i was working in another monitor to create what my Boss requested me to do and i've done it with success and pride, all because of you. Thank You again, my friend.
Nobody would have explained it better than u did.Thank u so much.
Thank you my friend
i was hesitant to watch another excel dashboard like youtube video but honestly you really did a tremendous job explaining and showing what you did thank you so much!
Glad it was helpful!
The best Ms Excel tutorial I've come across 💯. Thanks
Thanks for watching
That was a brilliant walkthrough in creating a pivot table with dynamic doughnut chats.
I am happy you liked it
pure gold of 26 minutes, can't believe its free. thank you, sir, for the wonderful video.
Did you watch my recent tutorials?
I guess you'll like them too
What a perfect lecture and lecturer. Thank you for being so patient and crystal clear
Thank You Valentine
Great Teacher. Very clear step by step guidance
Many thanks!
Just a fantastic tutorial. One of the first I found easy to follow and paced to be instructive.
Thank You
thanks a lot M.Treacy I am personally motivated with your lessons.
You are very welcome Ngum.
Mynda Treacy is one o f the best instructors in the world. But, I am Nabil Mourad.
Wow! I never realized how polished Excel can be! Thank you for the tutorial. It's very helpful.
You're welcome. Please subscribe to be notified about new tutorials.
I don’t normally comment on videos but this tutorial was absolutely fantastic. You have saved me a lot of time and headaches.
Thank you for the encouraging comment... Please share on your social networks
Such a great video, I would pay to learn this yet you offered it free, I salute you.
My audience across the world deserves the BEST
literally THE BEST!!! Thank you so much!
Thank you
@@Officeinstructor i am unable to add my value in text box after selecting = sign
absolutely terrific thank you. Particularly impressed by repeating the steps verbally makes it much easier to take notes of tricky keying.
You're very welcome!
Thank you for very easy and clear speaker, and mixed it with fantastic ideas.
Thank you
very clear and concise information and very easy to understand, I feel this is something I could do now, so many tutorials seem to be too quick, but I picked this up a lot more easily with the clear, relaxed voice and explanations - thank you.
You're very welcome!
I invite you to watch the hundreds of other tutorials I have ... and Subscribe to my channel
Thank you
Voice is soothing and you speak at a pace to understand/follow.
thanks for explaining everything step by step and easy to follow. I'm not native english but your pronunciation is clear and brief for me
What a GREAT instructor, and great content!!!!!!!!
Thank you Pame... I encourage you to watch my other tutorials and Subscribe to the channel
Thanks a million...... I rocked in my presentation with your guidance........Thank you so much! God bless you!
Thank you for the nice comment... Did you Subscribe to my Channel? The Best Is Yet To Come
Best tutor so far. Great. Thanks...
Wow, thanks!
This is perfect! i am sure anyone can implement this after going through this tutorial for just once! Thanks for explaining it so well.
Excellent Tutorial and thanks a lot !
You are Welcome
Thanks for a wonderful free tutorial lesson.
Thank You very much Nabil, You are awesome. I had been trying to learn the Pivot Tables and Slicers and no was able to teach me cos I am such a thick skull. :) but you 26.28 minutes or video was extremely engaging and clearly defining each and everything that I now understand how to work with Pivot Tables and design the reports my boss has been asking for :)
Thanks Very Much, Only Allah can reward you for such a great teaching,
Thank you Kashif for the nice words. It is a pleasure to be able to help you in learning a topic in Excel
This tutorial is truly amazing and brilliant. Thank you for all the steps explained. Very precise!!
Greetings from Indonesia. Really enjoy learning from Your tutorial. The step by step process are well explained and makes it easy to follow. Thank You!
This tutorial is amazingly good. I learned a lot from it and it gave me some inspiration for my classes (I give Excel classes to students). Thank you so much! Fan +1 😊
You are most welcome
Awesome sharing. This is what exactly I look for - clear steps and explanation. Well Done. Thanks for sharing.
You are welcome!
Well done! Just the one step of using the equals and cell for the text box was new to me (along with much more) and worth watching.
Me too.
Nice one.
using equal in cell text box will only work if =GetPivot function is off. If you don't want to off it then you'll need to create a helper-identical column of Sales Revenue
Brilliant. I followed and it was like a walk in the park.
what a great job, Congrats! Thanks for sharing your knowledge!
This is so solid and can be applied to all kinds of data. Thanks so much.
Glad you liked it
Very Good tutorial. Many important tricks I understood from this tutorial. thank you.
Thank you... Glad you liked it
well explained. thank you so much sir,
Thanks for sharing wonderful knowledge Pivot Table in Excel.
Thank you for sharing such a piece of good knowledge!!
Very detailed intructions. Thanks, i learned a lot!
Glad it was helpful!
Well done Sir...Thank you for sticking to the point and explain things very clearly... Just well done...
Thank you and glad you like it... I invite you to watch my latest tutorials
I LIKE THE WAY YOU SPEAK THANK YOU SO MUCH
Thank You
Very smart and professional
Thank you
Thank you for your nice comment.
Please share the video on your social media
Very nicely explained and each step is shown very properly so it easy to understand .. liked it
Amazing Tutorial. thank you so much!
Interesting and smart way to create the donut charts.
Hi there, this was a fantastic video! Thank you for this!!
Thank you
Glad you like it... Watch and share my newly posted tutorials
Thank you so much. Very simple and clear explanation running through the video and same time action taking place on laptop
Top tutorial! Thank you very much for sharing.
Brilliant Easy to Follow, Step by Step Instructions! Kudos to the Tutor 👏🏼👏🏼
Thank You Vishal
Wonderful tutorial
Thank you for your nice comment.
Please share the video on your social media
Sophisticated explanation Sir.
First of all I would like to than you for awesome presentation. In this tutorial I'm unable change series chart type since custom combination is not available to select secondary axis. Note:- I am doing this on Excel 2007
Please download Office 2016 from official website of Microsoft. I will provide you activation key
Yes u can, you need to apply the whole process on primary axis.
Jessica and Mike are lucky to have such a great tutor!
Phenomenal tutorial
Superb Sir. I dont understand the thumbs down business. Post more videos.
Thank you Anand...
For the Thumbs down, it simply shows that in Life you cannot make everyone happy... Even god did not make everyone happy
Very nice tutorial. Thanks a lot!
presentation & trainning is superrrrrrrr
Thank you so much 🙂
super, thanks for teaching, left my tip :)
Boss you are genius !!!! You made my report so attractive and easy
Great video thank you. Could we modify the data to implement conditional formatting, i.e change in Green if for example above 80%, but red otherwise?
Sir! You are really one of the great teachers .
I thoroughly enjoyed your tutorial! Thanks so much. I did want to inquire though if you could explain the intent of how the helper column impacts the progress doughnut chart? Why exactly was that necessary (the '=1' equates to 100% is what I figured) but how does that actually interplay into the chart in the interactivity part?
minute 11:30 , it shows a secondary axis which 39% is the actual sale ( the actual part that will be seen) and 61% the transparent which is the leftover, non sale
Staggering. Amazing. Thank you very much. If you come to Ireland, I'll buy you a beer!!!
Ok deal
and if you come to Toronto, I'll get you a beer as well
Thank you so much!!! Love it 💖
This is a very powerful instructional video. It's clear and easy to understand. Thank you Nabi ! ! !
it's look so nice , appreciated.
Very great Nabil so nice presentation and explanation very vivid
Glad you liked it... Watch my recent tutorials
Cool.
I've just used this in one of my dashboards. One problem I've run into is that for certain filter combinations some of the rows have no output (the value is zero) so Excel hides it which means that the doughnuts pick up the wrong row. I had to use the field settings to make sure it shopws row with no data.
By the eay, what version of Excel are you usign there? At work I have to use Excel 2010 because of compatibility with vertical applications, that doesn't let you do the secondary axis. On my personal machine I have Office 365 Pro Plus (Semi-Annual channel) which does but I noticed that some of the settign look different. If I create the dashboar don my personal machien it still works in 2010 on my work machine. Thanks.
In this case you have to make sure that all Seller ( for example) have done some sales on all regions so you can insert a data for all seller for all regions with 0 amount. So even if the seller did not sell for an specific region it would appear as 0. That is how I resolved here.
I used at the time of recording Office 2016...
BTW, forward compatibility always works, backward compatibility not guaranteed.
What exactly did you do to solve this problem. I'm facing same problem.
Thank you so much for the video. Was very helpful. Look forward to more content on data analysis.
More to come!
Great video Nabil. Thanks for sharing. Think i'll have doughnuts for dessert later too. :-)
Good job sir! Straight to the point explanation. Thank you!👍
جزاك الله
Would you please add source file for downloading.
The best tutorial for Pivot Table, Progress chart and Dashboard all in one place
Thank you for the nice comment. Kindly share my tutorials to your social media... You can download the start file by going to my website www,OfficeInstructor.ca and click on "Downloads"
@@Officeinstructor what is the file's name?
File name: "Progress Doughnut Chart"
I do not understand how do you got some dislikes, its simply cool and easily understandable.. Appreciated..
@@mukundanandan8614 Because the file on link has only source, no doughnut chart, may be, the reason!:-)
Brilliant ...amazed what excel can do - i never knew
Keep learning
When i click on donut arrow it forces me to chose between the existing ready donut
Very nice and helpful for a beginner like us. No idea who all dislike this tutor.. anyway m very much happy and definitely try with my project with this formula 👍👍👍
GENIIIIIIIIIOUSSSS!
you are so kindness
No
Superb video, great illustration and you covered it so well in this video
Thank you so much 😀
Very nicely explained..... Thanks for the tutorial
Nice tutorial. Learnt about creating dynamic dashboard quickly.
Thank you very much for this amazing tutorial.
Dear Believe me you done great work..
Thank You
Great tutorial for me. Thank you very much. We wait for the next!
thank you, it is really good to see your dashboard, the way you explained is pretty good
Glad you liked it
This is very great sir
Thank you so much, I followed it and I got it
This is gold... Thank you sir 🙏🙏🙏
So nice of you
Its a very good video to learn and to understand easily
Ciao e piacere di Aver conosciuto i vostri video.
I enjoy it and your video help a lot THANK YOU SO MUCH!
Glad it was helpful!
Thanks for the Tutorial. It looked difficult in the beginning, but you made it easy to learn. Learnt something new today.
just super! So many tricks are illustrated in this one project so well and with such ease. nice!
Thank You
Clear and concise!
Glad you like it
Very clear explanation, and everything step by step...brilliant...congratulations!! Awesome job!
Thank you very much!
Brilliant and simply superb...I have never seen such video on office yet..I am amazed how you did all this in an Excel....Great Job keep it up.
Glad you liked it... Did you subscribe???
Stay Tuned... The Best Is Yet To Come
wow! what an impressive dash board! thanks for sharing your expertise
Thanks for watching!
Wow i have never seen anything like this before wonderful
Thanks for this wonderful teaching
Awesome explanation. I am very greatful to you. Thank you.
Excellent Tutorial Nabil! Very cool, very well explained and put together!! 👍👍👍
Thank you Surendran.
I'm glad you liked it.
Did you watch my latest tutorials?
@@Officeinstructor No, but I will now! Thanks!
My Friend, you are a legend, thank you!
Now I understand pivot tables. Quite clear and easy to follow. Well explained and thank you very much, Sir.