How to Make Gantt Chart in Excel

Вставка
- Опубліковано 10 лип 2024
- 🔥 Learn Excel in just 2 hours: kevinstratvert.thinkific.com
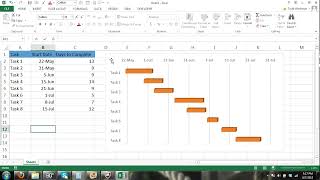
In this step-by-step tutorial, learn how to make a Gannt Chart in Excel. We start by creating a data table with start dates and estimated time needed. Next, we insert a stacked bar chart and make some tweaks to the chart to make it appear as a Gannt Chart.
📚 RESOURCES
- Sample workbook to follow along: 1drv.ms/x/s!AmxrofZZlZ-whZ9_x...
⌚ TIMESTAMPS
0:00 Introduction
0:16 Format data
2:39 Insert stacked bar chart
3:24 Turn into Gantt chart
7:08 Wrap up
📺 RELATED VIDEOS
- Playlist with all my videos on Excel: • ❎ How to use Excel
📩 NEWSLETTER
- Get the latest high-quality tutorial and tips and tricks videos emailed to your inbox each week: kevinstratvert.com/newsletter/
🔽 CONNECT WITH ME
- Official web site: www.kevinstratvert.com
- LinkedIn: / kevinstratvert
- Discord: bit.ly/KevinStratvertDiscord
- Twitter: / kevstrat
- Facebook: / kevin-stratvert-101912...
- TikTok: / kevinstratvert
- Instagram: / kevinstratvert
🎒 MY COURSES
- Go from Excel novice to data analysis ninja in just 2 hours: kevinstratvert.thinkific.com/
🙏 REQUEST VIDEOS
forms.gle/BDrTNUoxheEoMLGt5
🔔 SUBSCRIBE ON UA-cam
ua-cam.com/users/kevlers?...
🙌 SUPPORT THE CHANNEL
- Hit the THANKS button in any video!
- Amazon affiliate link: amzn.to/3kCP2yz (Purchasing through this link gives me a small commission to support videos on this channel -- the price to you is the same)
#stratvert #ganttchart #excel - Наука та технологія


simple but still useful Gantt chart. this tutorial must help excel users.
Hi Kevin, I've always been wanting to do a Gantt Chart in Excel for my home reno without using Microsoft Project. You made it a reality with your excellent tutorial. Thank you so much!
This great! Can you do another on that expands on this to include-
1. planned start/end dates
2. dependencies?
3. % complete
I’m so glad your shorts turned up on my feed, your tutorials are really well presented and easy to follow. Thank-you.
I used gant chart 3 years back for a course assignment. Now I joined another one,Perfect timing as Iam supposed to do assignments and completely forgot how gant chart works
It's a little tricky in Excel, but once you run through it, it works quite well. 👍
Once again I see immediate value, benefit, and uses for this. Excel-lent explanation.
This is such a great easy to follow tutorial. Thank you!
Keven, thank you very much for the clear explanation at an appropriate speed. Highly useful! :)
Wow just did my first Gantt Chart for my project management on my Master's. Oh god, I'm proud of myself. ThankThank Thank you so much yes. You are the greatest.
The perfect tutorial!! I had no clue what a Gantt Chart is and how to do it for my homework, and this video saved me. Thank you!!
You are legend bro.....
I just helped my girlfriend with her project and she thinks I'm a super star....
Subscribed already 👏👏👏
Excellent tutorial and a great improvement towards what I previously used to do. Thanks so much!
I had to re-watch this vid 3 times and kept on pausing every step of the way but, finally I made it! thank youuuuu
amazing tutorial, I always sucked at making charts, you saved me big time.
You Kevin are a master. A master who saved my task bacon. Thank you so much! Nick
So perfectly explained! thank you so much!☺
This video is a life saver literally took 5 minutes very useful considering it's 2.5 hrs before my assignment deadline
Very Helpful. My class wanted me to use PPT template for an assignment but this was easier for me. very self explanatory! Thanx for the video man!
Omg, this is genius. Thank you
It was soo useful to me, thank you to speak slowly, it was easy to understand for not perfect English speakers too😊
You are a great teacher!!! All the best from the entire world!
Love your video tutorials!!! Thank you!
great tutorial. Clear and to the point explanation.
i tried this but failed miserably, maybe because I am an excel noob. But there are no other tutorials available which are recent. So I am going to give this another try.
😂😂take heart
Try use the app not web
take it slow and don't move forward until you have completed the tasks exactly the way they are explained. It takes a bit of time but this is the best tutorial for gantt charts in Excel. it also gets easier after you have done it a couple of times.
Thanks so much! This was really helpful! Now I have a good Gantt Chart for my Project Milestones
This was a very informative video. Thanks, Kevin.
Kudos to you 👏🏻👍🏻. support from India ❤
Thank you Kevin, this video was very quick and easy to follow
Thank you Kevin. I needed this for my final college Senior project!!
I graduate next month🎉
Thanks Kevin, very informational.
Genuinely, such a well done video. Thank you!
Thank you so much, I needed to make a Gantt Chart for College Project!
Literally saved me hours today, thank you
Great video. Always wanted to get a gannt view in Excel
I am very impressed because I learned a new skill called creating a Gantt chart.
Kevin love from Pakistan. Your way of teaching/coaching is awesome 😎
Crisp and Clear.
hey kevin.. short and effective guidance. I got it well. Thanks !!!
Great video Kevin! Is it also possible to mark tasks with % completion to see progress in the gantt chart? Thanks un advance.
I did it without struggles thank you Kevin
Fantastic and very helpful video. You are a life saver!!!
Life Saver!!! Thank You
This is Amazing ! Thank you Kevin!!
This was very helpful. thank you.
Your videos are AWESOME!! Thank you very much.
Thanks Kevin, saving my college life as per usual
Thanks Kevin, this was really helpful. Any idea how to plot if there are multiple sub-tasks under each task/activity, with different start dates and end dates?
Thanks you, my assignment done perfectly! through your guidance
Hi Kevin! Thank you so much for this video. It helps me a lot.
This was very helpful, thank you.
This was sooo good, thank you, Kevin.
Thanks Kevin for this useful video!
Brilliant vid, thanks for sharing this Kevin....
Fantastic, thank you!
You bet!
Awesome video. Thank you sir ❤
Thank you sir! This is an excellent tutorial.
Very helpful. Thanks!
This is great. Question... is there any way to add value field to each task, that would show on each date, that would calculate the total on the x axis? I hope that makes sense. Thanks
thank you for making these updated tutorials! they were completely out of date.
God bless you sir
Thanks so much
this was great, thank you !
Thank you Kevin I love you
🤩 Really bright and Samrt, liked it so much
Thank you for this video.
Thank you very much, it was helpful :)
Very nice gantt chart in Excel ! I'll try it
Thanks a lot for this 🙏🏽
This is very helpful!
Great tutorial video as usual Kevin. I will share this with my project management students next week!
You are the best Kevin :)
Thanks!
Thanks a lot
Thanks Brother
Thanks.
Well done!
this is great
This is awesome!
Excellent video, very clear to understand.
Great to hear!
Thank you so much!
Great video!
Hope you do a tutorial on the Likert scale chart.
Very nice!!!!!
Amazing!
You are a genius... I barely followed this lol.
The best content creator in explaining the steps to make a GAANT chart. Are you on skillshare??
THANKS !!!!
great tutorial
that was brilliant
Thanks a lot man
Very usefull, THX!
Glad to hear that!
Thank you for this! And I'm just wondering whats the point of using workday if you need to factor in weekends? Is there another way to do this?
Can this be used to visualize cash flow?
Either daily or hourly?
Perfect 😁👍
HI kevin. why did you have to change the format of dates to 'numeric/ ( general) before creating the chart ? Thanks
The Stacked bar chart we want doesn’t show up as an option if not 👍
Thanks for sharing this video, Could you please share working sheet, thank you
Hello, this was very helpful, thank you! However, I'm new to Gantt charts, I'm wondering why you created a stacked chart only to remove one of the stacks? What is the purpose of this?
Thank you!
Hello Kevin
Some of the "the to do items" get omitted from the chart although I have highlighted them on the table.
Super vid!
Here I was, concerned about getting given nothing but broken accented, royalty free music, low quality screen cam videos. Because that is what tends to happen when you ask more and more specific questions on UA-cam.
You sir, have saved me.
High quality, easy to understand, divided into modular parts.
Thank you.
You have no idea how refreshing this is.