How to find peaks and label peaks of UV-vis. and FTIR spectra in Origin software

Вставка
- Опубліковано 8 лют 2025
- In this video, How to find peaks and label peaks of UV-vis. and FTIR spectra in Origin software
I want to share with researchers in materials science and nanotechnology a set of free tutorial videos. The videos include how to deal with some important programs that are used to represent the results of various measurements.
1- FTIR Plot in Origin
• FTIR Plot in Origin #F...
2- How to calculate FWHM and crystallites size from XRD data
• How to calculate cryst...
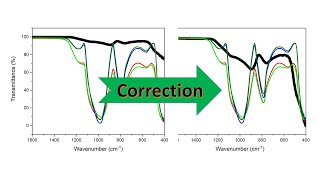
3- Create Baseline correction for FTIR spectrum using Origin
• Baseline correction in...
4-How to make double Y-axis plot in Origin
• How to make double Y-a...
5- Grain (particle) size distribution of SEM/TEM using imageJ Software
• #ImageJ_Analysis #Hist...
5- XRD analysis using XPert HighScore Software
• #XPert_Highscore #XRD ...
6- XPert Highscore Plus Software Installation for XRD Analysis
• How to Download and In...
7- Slope of line/graph in origin program
• Slope of line/graph in...
8- Direct and Indirect Band Gap Energy using Tauc Plot
• Direct and Indirect Ba...
9- XRD Plot in Origin Program
• How to draw XRD in Origin
10- Extract data from image via digitizer tool’s using Origin lab
• How to get data from i...
11- Crystal phase identification by XRD data using QualX software
• #Qualx #X_ray_Diffract...
12-How I can smooth XRD data using Origin software
• How I can smooth XRD d...


بارك الله فيك
جزاكم الله خيرا
شكررررا
جزاك الله الف خير بصجق توضيحك ممتاز.. بس سؤال ياريت تنزل استخدام الأورجن ف uv وأيضا رامان
خصوصا ال Raman
@@mostafafarouk2554 هل انت ايضا تحتاج للتوضيح
merciii
Which peak is Lambda Maximum in this graph?
عندي سؤال : في ال FTIR في عينة فلم لمادة TiO2 في رينج من 1200 تقريبا الى 3400 ظاهر عندي فوق ال 100 في محور transmittance ؟! فما السبب او التفسير في مثل هذا الوضع
مالوش تفسير ، يمكن تم عمل الbaseline correction بشكل غير صحيح ، لكن هذا لا يؤثر. ، اهم حاجة characterization peaks. الخاصة بالمادة ظاهرة هذا هو المطلوب
@@PhysicalConcepts شكراً جزيلاً الله يطمنك
و البيكات الظاهرة في المنطقة المذكورة سابقاً احسبها ولا تُهمل ؟!