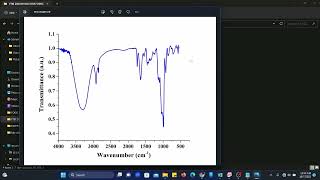
Thank you very much, that's exactly what I was looking for :) Btw it still bugs that FTIR data are from 0-100 and UV-Vis are from 0-1, it's a little bit of extra work when i when to show the full transmittance range of my samples.
Glad it helped. For FTIR, normalize your data from 0-100 and for UV-VIS, normalize your data from 0-1. These options are there, as I shoed in the video. Thanks
Salam Sir ,Uv Spectra is infront of me, but I am unable to analyze it, I have a pure compound and then different concentrations of doped compound ,what should a beginner do ,what and how she should start collecting info..plz correct me. thank u
You'll have to study some relevant literature regarding your work and then will be able to interpret your data. If you face any problem in the Origin, you may ask me. Thanks
Thanks. There are 3 to 4 familiar ways in normalization, you'll have to check which one is suitable for your plots.You may share your plot, I can say something exactly after seeing it
before you "normalise data you should think about why you are doing this and what you are doing. Just to make data look good is the most crappy reason to manipulate data.
@@SAYPhysics Thanks. But for FTIR, you made a shift of normalized plot to look it beautiful. Did not it change position of the peak? Again doesn't normalization of only one plot give you a wrong interpretation with respect to Y value while other plots have different Y scale? Just curious.
I'm sorry to say but this abrupt normalisation method for the UV vis is not correct at all! If you have performed baseline correction with respect to the corresponding sample reference then the non-zero absorption at 800 nm would refer to scattering. One cannot normalize a scattering sample between [0,1]; doing that completely undermines the scattering while boosting the absorbance in equal scales. Almost always your spectral shape will change while doing this and it is non-physical. Also shifting IR data in x-axis is absolutely weird! This will result in falsification of data! As a scientist, I kindly request the maker to clarify these points. There's nothing wrong with Y-scale normalisation of any kind of data. But kindly don't move X-scales and have a look in your minimum Y-value and ask the question why that changes, before manipulating any data.
You correctly pointed out, discussing peak positions should not involve translation along the x-axis, while discussions about intensity should avoid manipulating the y-axis. It's crucial to consider these aspects when working with spectral data to ensure accurate and meaningful results. Thank you for the input!


Muchas gracias, era justo lo que necesitaba!
de nada
thank a lot when u provide the exercise file. you a very delicate
Thanks for the appreciation dear 😊
Great video as always!
I appreciate that
Thank you very much, that's exactly what I was looking for :)
Btw it still bugs that FTIR data are from 0-100 and UV-Vis are from 0-1, it's a little bit of extra work when i when to show the full transmittance range of my samples.
Glad it helped. For FTIR, normalize your data from 0-100 and for UV-VIS, normalize your data from 0-1. These options are there, as I shoed in the video. Thanks
Hi @SAYPhysics, I tried to use same method but unable to normalize my UV-VIS data...?Could you please elaborate more about the procedure?
There are some other videos too in this playlist on normalization, watch them too please. Thanks
Salam Sir ,Uv Spectra is infront of me, but I am unable to analyze it, I have a pure compound and then different concentrations of doped compound ,what should a beginner do ,what and how she should start collecting info..plz correct me.
thank u
You'll have to study some relevant literature regarding your work and then will be able to interpret your data. If you face any problem in the Origin, you may ask me. Thanks
Thanks sir
So nice of you
Thank u sir...
How to normalise intensity in fluorescence decay plots?
Thanks. There are 3 to 4 familiar ways in normalization, you'll have to check which one is suitable for your plots.You may share your plot, I can say something exactly after seeing it
thank u
Welcome dear
how to normalise data with reference to some peak value?
Note the value of peak, and then in normalization dropdown menu select the specific number. Thanks
@@SAYPhysics can you please tell me the formula to do that? I want to do it on excel
Please do it in OriginLab as excel will require more efforts. Thanks
before you "normalise data you should think about why you are doing this and what you are doing. Just to make data look good is the most crappy reason to manipulate data.
Sometimes we're interested to focus on the position of a peak than it's intensity, we do such a normalization for that reason. Thanks
@@SAYPhysics Thanks. But for FTIR, you made a shift of normalized plot to look it beautiful. Did not it change position of the peak? Again doesn't normalization of only one plot give you a wrong interpretation with respect to Y value while other plots have different Y scale? Just curious.
The normalization is of y axis only, while shift occurs in the x axis. When we use au on the y axis, it doesn't matter then. Thanks
I'm sorry to say but this abrupt normalisation method for the UV vis is not correct at all! If you have performed baseline correction with respect to the corresponding sample reference then the non-zero absorption at 800 nm would refer to scattering. One cannot normalize a scattering sample between [0,1]; doing that completely undermines the scattering while boosting the absorbance in equal scales. Almost always your spectral shape will change while doing this and it is non-physical.
Also shifting IR data in x-axis is absolutely weird! This will result in falsification of data!
As a scientist, I kindly request the maker to clarify these points. There's nothing wrong with Y-scale normalisation of any kind of data. But kindly don't move X-scales and have a look in your minimum Y-value and ask the question why that changes, before manipulating any data.
You correctly pointed out, discussing peak positions should not involve translation along the x-axis, while discussions about intensity should avoid manipulating the y-axis. It's crucial to consider these aspects when working with spectral data to ensure accurate and meaningful results. Thank you for the input!