Madam- i made an attempt to forecast (by following 3 yrs moving avg) for 2023 is 214, but 2024 is 148 (it is doubt) - by following your teaching guidelines
hlloo mam, Your explanation method is very good. I have a doubt, how to get the correct forecasted value by using MAD, MSE and MAPE values. Please give easy solution, it is important for me.
My question is simple: how come the forecast is lower than the trend? I would have thought that with a growing amount for each period, that the 7th value would have been higher than 465, irrespective of the method used. 443 means that I am forecasting a lower value, i.e. the trend will move down from period 6.
Hello mam, i have a query for moving average, when i calculated using "Data Analysis" option in excel to calculate Moving average for 3 years it gives values starting from 3rd year itself which should be starting from 4th year so got confused shall we consider 3rd year data for 3rd year moving average to see the trend or not, can you help please
Karpagam - One more question. I totally understand the logistics of calculating MAD, MSE and MAPE but I am missing a point - Why are calculating this MAD, MSE and MAPE ? What does it tell us ? Please help me understand. I will be glad to call you or even set up a google call. I learning statistics on own .... any help of great value to me
Man I am simple want What provide material agenst the forecast and what sales team sold the material agst the forecast I want calculate both the accuracy Pls suggest how to do that??
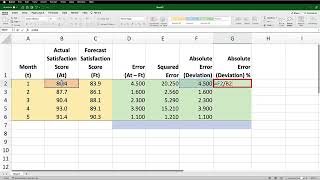
thanks madam for your video but i have comment i think you mistake in calculation of MSE where should divided into 2 instead of 3 please check and feedback
mam can solve the same sum through exponential smoothing method please........i have exam on Monday please ......for mse mape mad - exponential smoothing


Your teaching methodology is very inspirational & clear headed. Thanks
Glad to hear that :-)
This is so simply explained. Thank you
Honestly ur method is perfect thanks
Excellent explanation Madam. Very easy to understand.
Thanks a lot sir
Maam, your explanation is perfect. please add double exponential smoothing video as well.
Sure Indira maam, will upload the video shortly.
You made it so easy to understand. Thank you!
Hello Mam your videos really helps to recollect everything thanks a lot you teach very nice keep posting more videos...
plz make video on another topics of Finance as well. Budgeting decision, leverage etc. The way of you are explaining is great. please make videos
Thank you so much this is so much easier !!
You're the best❤
fantastic video mam..thankyou so much
Very Helpful.Thank you mam 🙂
very clear and easy to understand
love it thanks for making it so easy
great work !
Very Well Explained!!
Madam- i made an attempt to forecast (by following 3 yrs moving avg) for 2023 is 214, but 2024 is 148 (it is doubt) - by following your teaching guidelines
What does the mse, mape % denote? As in case of coeff we say lesser the coeff more consistent & vice versa similarly is there anything with error!
Thank u Madam for your explanation.
Thank you. The best.
To calculate MAPE, can we consider only years or is it applicable on a monthly basis as well?
hlloo mam,
Your explanation method is very good. I have a doubt, how to get the correct forecasted value by using MAD, MSE and MAPE values. Please give easy solution, it is important for me.
I want to know too
Excellent teaching ..
My question is simple: how come the forecast is lower than the trend? I would have thought that with a growing amount for each period, that the 7th value would have been higher than 465, irrespective of the method used. 443 means that I am forecasting a lower value, i.e. the trend will move down from period 6.
Can you explain linear regression method of forecasting ?
I wish to ask that what is the difference between Dt and Ft in the formula? As Demand and Forecast are same.
Many thanks
Thanks ❤
Thank you so much
Hello mam, i have a query for moving average, when i calculated using "Data Analysis" option in excel to calculate Moving average for 3 years it gives values starting from 3rd year itself which should be starting from 4th year so got confused shall we consider 3rd year data for 3rd year moving average to see the trend or not, can you help please
Hi Amit, for trend analysis use excel data analysis option, whereas for forecasting the next period, use the method that i have shown.
What about the Root mean square error and display it on a chart?
Karpagam - One more question. I totally understand the logistics of calculating MAD, MSE and MAPE but I am missing a point - Why are calculating this MAD, MSE and MAPE ? What does it tell us ? Please help me understand. I will be glad to call you or even set up a google call. I learning statistics on own .... any help of great value to me
They give spread of error to see how accurate the predictions are. They are all variations on measuring spread of error.
@@DwightWalker MSE.. i couldn't find the need of it
MAD, MSE, MAPE what does tell us..? How to calculate the accuracy of provided material agst the foreacst and what sold agsnt the forecats
you mean every month we will less forecast appx 13% ? and it will continue ... in 7th year also you are granting only SMA ...
very helpful
Thank you ❤️
Karpagam - I have Incidents for month 1 to month 10. I need to estimate incidents for month 11, 12 and 13. Is it possible to moving average ....
thank you mam
Thanks
for 7th year it is ok , how we can calculate 8th year forecast
madam
Man I am simple want
What provide material agenst the forecast and what sales team sold the material agst the forecast
I want calculate both the accuracy
Pls suggest how to do that??
ok so why anyone would like to do this Simple Moving Average method if we have other option, because this is very lengthy
why do we need to calculate for the error?
Mam where is the starting forcast demand
thanks madam for your video but i have comment i think you mistake in calculation of MSE where should divided into 2 instead of 3 please check and feedback
Why is that 2 instead of 3, any reason?
mam can you solve the same sum through exponential smoothing method please........i have exam on Monday please ...... upload.
Sure Rahul, I will upload the video on or before Sunday afternoon
@@karpagamqtcorner8764 thankyou madam
best
What if the forcasted demand was bigger than the actual demand, the error will be in minus
Yes, but due to absolute error, it will be considered positive in the next column.
What happens if mean average is negative
mam can solve the same sum through exponential smoothing method please........i have exam on Monday please ......for mse mape mad - exponential smoothing
Mam!
please interpret the results
Kindly please answer soon. I am waiting.
1 has to be subtracted to measure MSE
Hey you did a mistake. You have to subtract 1 from denominator in MSE
Can you explain the mistake more I didn’t understand what do you mean is it a big mistake?
Really?
Please can I’ve ur email 📧