Applying the central limit theorem to find probability example 2

Вставка
- Опубліковано 11 лип 2019
- **There is a tiny error at the very end of the video (at about the 7th minute) after I have found the area from the z-table. When subtracting my table area from 0.5000, I somehow make a typo in the last digit. I subtract 0.4984 from 0.5000 instead of subtracting 0.4986. Everything prior to that is correct, so just finish the problem by doing 0.5000 - 0.4986.
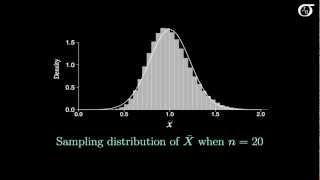
In this video, we demonstrate how to use the central limit theorem to find a probability. Ultimately, the central limit theorem allows us to convert the problem into a problem of finding area under the normal curve. The only change is that we use the standard error instead of the standard deviation.
This video is part of the content available for free at www.statsprofessor.com


There is a tiny error at the very end of the video (at about the 7th minute) after I have found the area from the z-table. When subtracting my table area from 0.5000, I somehow make a typo in the last digit. I subtract 0.4984 from 0.5000 instead of subtracting 0.4986. Everything prior to that is correct, so just finish the problem by doing 0.5000 - 0.4986.
Clear,Concise,Cool💪
Thank you and love your clear instructions! Due to the typo error, the last calculation was wrong and it lead to the wrong answer. Z value supposed to be 0.4986 and the correct answer is 14%.
Yes, you're right. I have that correction under the video at my website, but I forgot to put it here. It is in the video description though. Thanks!
why isn't it 1 - .4986? Aren't u still subtracting from 1 since 1 is the area under the curve & .4986 accounts for the area to the left of 74k therefore, to find shaded area u need to subtract value from 1
You are right that the total area under the curve is 1. Since the curve is symmetric, the total area in half the curve is 0.5000. The z table I used gives the are from the z score you look up to the mean of zero. Some tables give the area from the z score to negative infinity. I think you may be thinking of that type of z table. There are many z table designs. You need to know how each one reads to use it in these problems. You can learn about the table used here by watching this set of videos: ua-cam.com/video/FwlD7jDRBGA/v-deo.html
I have Question why x-bar is higher than 74,000 ? could you please explain
The curve represents the distribution for x-bar when n is 31. We are asked about the probability that a random sample of 31 has a mean greater than 74,000.
Why we did not substract 1-0.4986?
Hi Charbel, it might be correct to do that on your z table. It depends on the table you are using. For example if our table gave us the area from the z score to negative infinity, then you would calculate 1-0.9986 as your final answer. My z table gives the area from 0 to 2.98 as 0.4986. From 0 to infinity is 0.5000 under a z curve, so we subtract 0.4986 from 0.5000
your z score table and mine are different
Me too.
All z tables are unique. You have to determine what area your table provides under the curve to determine how to use it. My videos use a table that gives the area from 0 to the z score looked up. Some provide the area from the z score to infinity. Others provide the area between two z scores. Others give the area from the z score to negative infinity. It doesn't matter which table you use. You just have to use it correctly depending on what your table provides.