Applying the central limit theorem to find probability example 3

Вставка
- Опубліковано 11 лип 2019
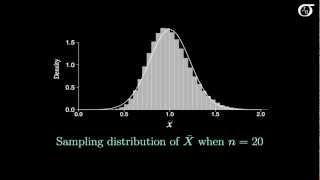
- In this video, we demonstrate how to use the central limit theorem to find a probability. Ultimately, the central limit theorem allows us to convert the problem into a problem of finding area under the normal curve. The only change is that we use the standard error instead of the standard deviation.
This video is part of the content available for free at www.statsprofessor.com


Hey, why didnt we subtract the Zscore for -2.86 from 1 as it gives us the left hand side value.
Hi, I dont understand what tables you are using to find the z scores, I dont have those values at all
Hi Paula, there are many versions of z tables. You have to read the label at the top of the table to know how your table works. The overall process is the same, but the table will determine the way you complete the last steps.
me either
Hi Dane great video. My question is why do we add both the values in this example but in the example 1 with the marriage for women we subtract the two?
It depends on the z table that is used to find the areas. The one used in these videos gives the area from the z score to the mean (0). Since we have areas shaded on both side of the mean, we have to add the two areas together. If we have a shaded area on just one side of the curve that is between two z scores (both z values on the same side of the curve) we need to subtract the two areas we get from the table. This is because the z score further out from the mean gives an area that is too large. The area from the closer z score is the exact amount of extra area the fist z scores has.
Hello Dane, can i know from the chart how and why 0.05 and 0.07 are selected for 1.35 score of Z and -2.87 score of Z
The reason is that this z table provides the first two decimal places of the z score on the left column of the table. That helps us to locate the correct row of the table, but to find the correct value in the row we must look up the last decimal place along the top row of the table. That will allow us to find the correct area. There are many different types of z tables, so you can find other versions online if you prefer a different table.
You should subtract the numbers instead of adding them