Labelling gene clusters using Artemis's DNAPlotter software.

Вставка
- Опубліковано 9 лют 2025
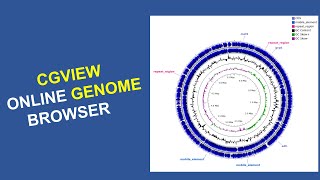
- DNAPlotter is a tool that allows circular and linear interactive genome visualization.
The software can be used to generate images of circular and linear DNA maps to display regions and features of interest.
This video provides a quick guide to producing an image / figure of a bacterial genome using the Artemis DNAPlotter tool. The video also shows how to make lovely images of the genome highlighting regions of interest. This might be useful for anyone starting out using DNAPlotter or for students who need figures for presentations or reports etc...
I have used DNA Plotter in this video to visualise a whole genome and highlight a cluster of genes.
You can read more about this software at:
DNAPlotter: circular and linear interactive genome visualization. Carver T, Thomson N, Bleasby A, Berriman M and Parkhill J. Bioinformatics (Oxford, England)


How do I get my forward and reverse strands to be on different tracks? I tried with track manager but it just keeps deleting my genome
Hi, I just tried this myself. I first opened a GenBank (GBK) file in DNAPlotter. By default this opens up an image where the predicted CDS on either forward or reverse strands are on separate tracks (seen as concentric circles). Are you using a GenBank file - or other genome annotation file - in DNAPlotter?
an easy tutorial is on the link:
home.cc.umanitoba.ca/~psgendb/tutorials/artemis/dnaplotter/dnaplotter.html#:~:text=DNAPlotter%20is%20used%20by%20Artemis%20to%20render%20maps,shows%2C%20from%20the%20outer%20circle%20and%20going%20inwards%3A
@@genomeprojects I am using a fasta file. Do I have to use a genbank file?
@@elMARABIYOCHO1989 you need to use an annotation file to see forward and reverse genes. Using a plain nucleotide sequence file, nothing has been predicted as forward or reverse yet.
@@genomeprojects What can you recommend for annotation? I used GenemarkS and then just used the Add Feature in DNAplotter to add the CDS
I tried downloading java and artemis but it doesn't work. I keep getting an error message from java
Not had this problem (for Artemis anyway). Could try to update or check your current Java edition / Run Time Environment is compatible with Artemis. Remove old versions of Java from system. Could also try Right click on Artemis and try troubleshoot compatability or reinstalling Artemis altogether. Hope you get it sorted.
@@genomeprojects I changed the java version and it now works. Thank you so much😀
Cool...glad you got it to work. Well done!
@@genomeprojects How do you get to have the forward and reverse strands on different tracks? I tried updating tracks and it just deletes everything. I have had to restart multiple times since it deletes everything each time I hit update tracks
How to add cog annotations to genome plot in dnaplotter?
One way of doing this: In DNA plotter - go into options - then into DNA WIzard, you can adjust the labels there to COG identifiers. Or, chose the linear genome configuration in DNA Wizard, zoom into the area of interest, double click on the CDS and change / add a COG label there.
Hello! Is there a way to save the session in case I need to go back and make edits? The problem is, maybe I need to make changes, there's no way to save the session to come back and make the changes to it later. If I label 100 genes manually, it won't save the work, I have to save the image with no ability to edit it later. Any solution?
Hi, There are probably several ways of doing this, here is one that works.
You will need to open and make changes to the sequence/annotation in Artemis. First open Artemis with your sequence and select "save in between sessions"
In Artemis, select the coding sequence/gene of interest that you want to annotate and right click. From the menu that appears, select "edit" tab, then "select feature in editor". This will open up a box showing sequences as well as gene and gene product names. The text in here can be changed.
Change the gene and gene product names to whatever you want. When all gene names have been added or changed in Artemis, then save and goto file and select: Open in DNAplotter. Opening DNAplotter from Artemis will reflect the changes made. In DNAplotter, go to options and select DNAwizard, select "edit current DNA display" you can see the changes made in Artemis are now in DNAplotter.
To go back to the version you made changes to, open the saved Artemis file then re-open in DNAplotter.
Hi, your videos are life saver. I wish to see these specific gene clusters in different tracks and not highlight them on the existing track. Can you please tell me how to do that in DNA plotter?
Hi, glad the videos help. When opening a full annotation file (like .gbk) in DNAPlotter, genes are shown by default on forward and reverse strands - depending on their predicted orientations. If you go into: options; DNA wizard; Edit current display and then select: Linear (at the top left of the panel) you can then see the two tracks, forward and reverse in a linear rather than circular form. You can zoom in by pressing ctrl I. If you want to add arrow heads or tails to illustrate gene orientations, go into DNA Wizard, find the CDS using the gene coordinates and then click the boxes marked either arrow heads or arrow tails.
I hope this helps to answer your question. Best wishes!
Thank you for your video. I'm just a begginer of everything related to this, can you tell me how to identify a gene cluster?
Usually clusters contain genes that are functionally related. Genes in cluster are also located in close proximity to one another within a genome. To identify clusters, I would predict gene function and look for cluster conservation in other / similar species. For bacterial genomes, many functionally related genes are encoded in operons and so predicting operons may also help to identify clusters.
Hello,
If I want to label some of the genes of interest in the plotter, how do I do it?
Hi, I added a short vid on labeling genes in DNA plotter, I hope this helps.
Thank you very much
Hi, I am glad you found this useful.