Build a Slicer Panel in Power BI Like a PRO - Part 2

Вставка
- Опубліковано 4 лип 2024
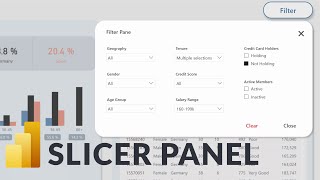
- This is the second part of the slicer panel video series.
In the first video we built step-by-step a custom filter panel in Power BI and in this video we create a conditional button showing the number of active filters. It also shows in a tooltip which filters are active.
You can check the first part here:
• Build a Slicer Panel i...
⬇️ Download Power BI file (Part 2):
drive.google.com/drive/folder...
📸 IG: / yourownkpi
🖼️ Dribbble: dribbble.com/YourOwnKPI
👨💼 LinkedIn: / zsolt-szabo-bln
⌚ Timestamps
00:00 Intro
00:53 Add filter counter
03:52 Button formatting
12:36 Add tooltip
18:10 Outro
#yourownkpi #yokpi


this helped my dashboard look so neat and tidy, thank you very much!
You elevated the dashboard to a new level. This is now my favorite Power BI channel.
Wow thats awesome :D
You and Bas are truly the master in Dashboard Design in PowerBI, this is just top notch content!!!
That's really motivating, thank you 😊
I also just watch him and Bas for inspiration.
You are literally a data and UX wizard.
What an excellent job, congratulations!!
Wow thanks :D I appreciate it
This may be the best filter pane on UA-cam, great job!
Ah :D I really appreciate it!
Thank you brother, its really a very knowledgable session, hats off!!
This is the best filter pane video I've ever seen on UA-cam. I always felt Power BI is really lacking proper filter options for end users. Your solution is everything I wanted it to be.
Thanks, that's amazing to read :D Yeah Power BI is primarly not a design tool and it has a lot of limitations. But I think it's catching up nicely and they keep adding new features.
Great work on this! Applied this logic to one of my key dashboards. Bravo!
thanks amd Im glad it helped :)
This is amazing, I can't wait to put it in practice. Thank you for the knowledge bit :)
Great :) congratulations!!
CTRL + D, powerful!
💪💪
you make my day bro, incedible 👏👏👏
Happy to hear that :D
The best, great job!
Thanks a lot!
I love your designs ❤
Amazing video as always mate!!!! thank you!
Glad you enjoyed it :)
Amazing!
Just brilliant. Thanks for taking the time to share. 💥💥👍👍
Thanks haha, Im happy to share it
just wanted to say that your videos are awesome!
Thanks! very much appreciated :)
Great work. Thank you
Glad you liked it!
Very interesting
Thank you so much! Great🙏
Thanks for watching :)
Awesome stuff
Awesome content! Can't wait to apply this number feature
Thanks! Im glad it was helpful :)
Was looking for this thank you Zsolt....
Youre welcme :)
i learned a lot. as a new power bi user. thanks
Youre welcome!
Good Job. Can't wait for part2. The filter bar will be interactive?
Thanks. There will be a tooltip in it showing the selected values for the active filters.
Amzing
First of all thank you for your content which is very helpful. I may have missed someting tho because when I am using my app in power BI, I sometime click in the shape of the panel instead of the slicer and panel then come in front en hide the slicers. Do you have any idea on how to fix this ? Thanks again.
Great work. You really do your best with the dashboard UX.
I wanted to ask did you use a custom visualization for the table?
I tried my best with the tables in PowerBI but the still look rigid as heck. Do you have any tricks up your sleeve?
Thanks :) No it's the native table and I used a shape for the header background. You can check out how it's been built in the download file
Waiting for next part video
Upload fast ❤
I try my best :)
Hey, this is great stuff thanks. FYI when you say "height" it is pronounced like "hi-t" not "hey-t" ❤
Oh thanks haha. I learned it once badly and saying it that way ever since 😩 I hope not to forget
This is really great and I'm new to Power BI, but trying to find my way. One question I have, I cannot get this filter correctly set if I'm using DATE, any solution/ idea for this
Great to hear :) What doesnt work correctly exatly?
Hi, this is very insightful, thanks a lot. Quick question, do I have to repeat the whole filter creation process on every page/tab I have? I tried copying and pasting but it takes me back to page 1 and filters only the data on that page. How can I solve this issue?
Youre welcome :) Yes you have to set up the bookmarks on each page individually
Hello, I like this video alot , but I have one question if I make a filter pane and filter the options and if i Have a power APP tool so will the filters remain unchanged ?
Hey thanks :) I can't really tell you, I'm not familair with the Power Apps
Awesome filter man!! I noticed when I select a single column value in a table visual the counter is activated and it shows a count of 3, and in some other visual like pie chart, it would show count of 2. Any solution to this?
Thanks! Thats a good point. What I can think of is to disable the interaction between the visuals in which slicer data is used. In the example it would be necessary to disable the interaction from the two column charts in the direction of both the filter counter and the button itself
hi. recent subscriber here. Question, at 8:07, how did you pick up and copy the blue color? I checked the Power BI documentation, and I can't seem to find the keyboard shortcut for that. TIA!
Welcome to the channel 🤗 I just had it somewhere saved and copied it with Ctrl+C Ctrl+V haha
@@yourownkpi Ha ha! I thought you were using a color picker since I could not find the keyboard shortcut. Nevertheless, still an amazing tutorial, learned. a lot. Thanks!
Great content - thanks!
thanks for watching :)
I am looking forward for part 3, 4, 5 and the other new videos you will make. May I suggest something? in your example, the result for the tooltip does not appear in alphabetical order, therefore I added this and I am sharing in case you'd like to use it.
CONCATENATEX(Filter_Table,[Value] -- [Value] é o nome default da coluna a tabela virtual
, "," -- Separator (optional)
,[Value] -- Sorting expression (optional)
,ASC) -- Sorting direction (optional)
---------------------------------------------------------------------------------------------------------------
and before I forget: This video is incridible.
Thanks for the suggestion. That's also a good option. In my case I wanted to sort the slicer names in the same order as they are sorted in the filter panel. And before I forget thanks again :D
Always inspired by your work Zsolt, thank you so much for sharing.
Thats great to hear and youre welcome :)