Bring Power BI to life with Figma | Timelapse email report

Вставка
- Опубліковано 7 лип 2024
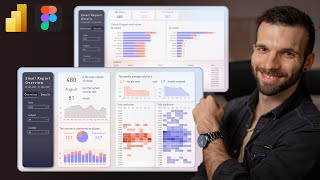
- This Power BI timelapse shows how to design an email report. I build two dashboards, an overview page and a details page. I do the background and button design with Figma.
Here is the tutorial and the pbix file for the report:
• Stunning Email Report ...
Instagram: / yourownkpi
Since many of you asked how I learn Power BI, here are some books I vouch for. I like to learn from books, because they provide a complete structure and they answer many questions I didn't even know I need to ask (not only as a beginner). I didn't read all of them form cover to cover yet but they gave me great value already nonetheless.
Amazon links to the books*:
📕 Data visualization
● Storytelling with Data amzn.to/3RDAh1J
It is my #1 recommendation. If you don't read anything else, just read this and you will be ahead of the majority of the Power BI developers in dataviz.
● The Big Book of Dashboards amzn.to/3PGU3XJ
It is another great book and ithas many use cases if you want to dive deeper.
📘DAX
● Supercharge Power BI amzn.to/3Pw179u
A great book for beginners, covers the most crucial DAX topics.
● The Definitive Guide to DAX amzn.to/3rAgGF7
The holy book of DAX, but more advanced.
📗Power Query & Data Modeling
● Master Your Data with Power Query amzn.to/3ZJWFZy
This book gets you started very quickly with Power Query and ETL.
● The Data Warehouse Toolkit amzn.to/3thz7Py
Data modelling is so important. Better data model = simple DAX and faster reports! Read the first 2 chapters to get the basics. Dive eeper into specific chapters later on.
*These are Amazon affiliate links which provide a small commission to this channel via anything purchased via these links.
Timestamps:
00:00 Intro
00:11 Power BI visuals
03:05 Design in Figma
06:03 Putting it together
#yourownkpi #yokpi


This isn't a Power BI report; it's an art.
Wow thanks :D
@@yourownkpi would you be interested in collaborating with me on a job posting machine learning project? I need some help with UI and UX.
hey sorry for the late reply. I don't have the capacities for anything like that now :/
@@yourownkpi hello sir, big fan of your work. I also want to learn power bi, can you help me from where i can learn power bi. From where did you learn, can you recommend any course please?.. and another 1 qes is To learn FIGMA is it required to learn HTML, and CSS ?? Without HTML CSS can I master FIGMA plzzz plzzz reply
Your videos are revolutionary. I never thought of using Figma together with PowerBI. This is genius.
Im glad you liked it :)
Just start learning PowerBI few days ago, and stumble upon seeing this art. its still a long waaay to get here
Geez, probably my new favorite channel. AMAZING!
haha awesome
Your timelapse is really nice inspiring. I will try to apply this tuto as soon as possible.
Ps: I discovered your UA-cam channel this morning and I am already a fan
thanks Im glad to hear :D Im working on the tutorial of this report with explanation currently. I will upload it in the coming weeks
Nice! Very nice! 😉
Looks amazing... One thing though...the music damn amazing too
haha thanks
please upload the full tutorial as well! It will be easy for us to practice.
Im working on it
Awesome. The images are placed as an background. Does this also work for mobile views?
I didn't do it for mobile yet but it should work just the same way. You need to adjust the layout for mobile however.
Hey this is magnificent! How long would you estimate this project takes you?
Hey thanks! It took me around 12 hours to come up with the idea, prototyping and importing it into Power BI
Good work, Will you share with me pbix file and figma file link for further practice
Thanks, I will do a tutorial and upload them there
This is so perfect but where is the dataset?
I made a tutorial for this and you can download the pbix file and the dataset from the link in the description:
ua-cam.com/video/0kYyvdhwjgo/v-deo.html
Awesome🥰..Can you provide the dataset
I will do a tutorial on this one, the dataset will be available there.
@@yourownkpi Thanks buddy🤝🏼
4:57 What are these circles for? They seem to do nothing.
The white frames are a little transparent and some visuals would blend in with the background colors. The top layer ellipses or circles are meant for making specific areas whiter to avoid this. The bottom layer ellipses are for a light reflection effect coming from the white frames.
amazing sir
don't you have a course on Udemy so I can learn from U ,
how can I design a dashboard like this one ?
thanks for these amazing Videos
👍
I see you already found the tutorial :)
ua-cam.com/video/0kYyvdhwjgo/v-deo.html
What's is the page size ? Tell about colors
Try to do slow ..as a tutorial ..
That's the plan in the coming weeks
@@yourownkpi great 😊
If this wasn't time lapse, how long do you think this took you?
The timelapse is at 10x speed and parts are edited out. Besides at this point I did this design multiple times so I knew exactly what I want. Coming up with the idea, prototyping and implementing it was maybe around 10-12 hours.