Standard Error of the Mean Compared to Standard Deviation using SPSS

Вставка
- Опубліковано 21 вер 2024
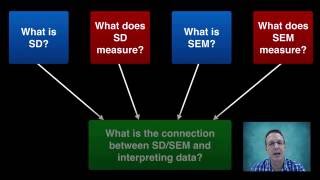
- This video demonstrates how to calculate and interpret the standard error of the mean using SPSS and compare it to the standard deviation. The standard error of the mean helps to determine a range where the true population mean may fall.


Dr. Todd indeed wonderful video!!! Merry Christmas and Happy New Year!!!
is there a way to then plot a bar chart and have the error bars represent the SEM and not the standard deviation? because there doesnt seem to be that option
This is great. Thank u for your effort to share this important knowledge. One query: you have mentioned 68%. Could you please explain how this factor 68% became in this calculation?
hello. u mentioned about 68%. where you got that percentage. thk u
PM KAIL In a normal distribution, it has been shown that 68% of scores fall within 1 standard deviation of the mean. That means that 68% of scores are between -1sd and +1sd of the mean. It is always 68%. (Similarly, it is known that 95% of scores fall within 2sd of the mean.)
PM KAIL PM KAIL In a normal distribution, it has been shown that 68% of scores fall within 1 standard deviation of the mean. That means that 68% of scores are between -1sd and +1sd of the mean. It is always 68%. (Similarly, it is known that 95% of scores fall within 2sd of the mean.)