Complete Azure Monitor explained with overview in 20 Minutes

Вставка
- Опубліковано 7 сер 2024
- Azure Monitor overview
Azure Monitor helps you maximize the availability and performance of your applications and services. It delivers a comprehensive solution for collecting, analyzing, and acting on telemetry from your cloud and on-premises environments. This information helps you understand how your applications are performing and proactively identify issues affecting them and the resources they depend on.
Just a few examples of what you can do with Azure Monitor include:
Detect and diagnose issues across applications and dependencies with Application Insights.
Correlate infrastructure issues with Azure Monitor for VMs and Azure Monitor for Containers.
Drill into your monitoring data with Log Analytics for troubleshooting and deep diagnostics.
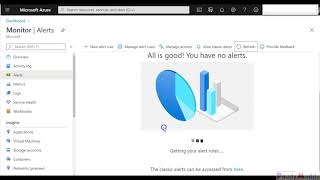
Support operations at scale with smart alerts and automated actions.
Create visualizations with Azure dashboards and workbooks.
Collect data from monitored resources using Azure Monitor Metrics.
All data collected by Azure Monitor fits into one of two fundamental types, metrics and logs. Metrics are numerical values that describe some aspect of a system at a particular point in time. They are lightweight and capable of supporting near real-time scenarios. Logs contain different kinds of data organized into records with different sets of properties for each type. Telemetry such as events and traces are stored as logs in addition to performance data so that it can all be combined for analysis.
For many Azure resources, you'll see data collected by Azure Monitor right in their Overview page in the Azure portal. Have a look at any virtual machine for example, and you'll see several charts displaying performance metrics. Click on any of the graphs to open the data in metrics explorer in the Azure portal, which allows you to chart the values of multiple metrics over time. You can view the charts interactively or pin them to a dashboard to view them with other visualizations.
Log data collected by Azure Monitor can be analyzed with queries to quickly retrieve, consolidate, and analyze collected data. You can create and test queries using Log Analytics in the Azure portal. You can then either directly analyze the data using different tools or save queries for use with visualizations or alert rules.
Azure Monitor uses a version of the Kusto query language that is suitable for simple log queries but also includes advanced functionality such as aggregations, joins, and smart analytics. You can quickly learn the query language using multiple lessons. Particular guidance is provided to users who are already familiar with SQL and Splunk.
What data does Azure Monitor collect?
Azure Monitor can collect data from a variety of sources. This ranges from your application, any operating system and services it relies on, down to the platform itself. Azure Monitor collects data from each of the following tiers:
Application monitoring data: Data about the performance and functionality of the code you have written, regardless of its platform.
Guest OS monitoring data: Data about the operating system on which your application is running. This could be running in Azure, another cloud, or on-premises.
Azure resource monitoring data: Data about the operation of an Azure resource.
Azure subscription monitoring data: Data about the operation and management of an Azure subscription, as well as data about the health and operation of Azure itself.
Azure tenant monitoring data: Data about the operation of tenant-level Azure services, such as Azure Active Directory.
As soon as you create an Azure subscription and start adding resources such as virtual machines and web apps, Azure Monitor starts collecting data. Activity logs record when resources are created or modified. Metrics tell you how the resource is performing and the resources that it's consuming.
Enable diagnostics to extend the data you're collecting into the internal operation of the resources. Add an agent to compute resources to collect telemetry from their guest operating systems.
Enable monitoring for your application with Application Insights to collect detailed information including page views, application requests, and exceptions. Further verify the availability of your application by configuring an availability test to simulate user traffic.
Monitoring data is only useful if it can increase your visibility into the operation of your computing environment. Insights provide a customized monitoring experience for particular Azure services. They require minimal configuration and increase your visibility into the operation of critical resources.
Application Insights monitors the availability, performance, and usage of your web applications whether they're hosted in the cloud or on-premises. It leverages the powerful data analysis platform in Azure Monitor to provide you with deep insights into your application's operations.
#PaddyMaddy #cloudComputing #azuretutorial #microsoftazuretutorialforbeginners


Complete Azure Monitoring overview
This is a great presentation of Azure Monitoring. I have watched others too and I feel this one helped me a lot more. And I love the accent! :)
Thank you for this session.
Buddy, how to export excel with alert rules name and charges applied on that alert on monthly basis. Pls reply.
Hi Paddy, How can I monitor and create alerts for micro services inside AKS and those dependent services through Azure monitor? Is there a way to do it?
Please reply thanks!
Bro casual English lo explain cheyandi… foreign accent doesn’t looks better..
I will try my best bro.. thank you for the feedback
Never once explained how to set things up from beginning to end. Not super helpful.
Thank you for taking the time to provide your feedback. We appreciate your input and take it seriously. We understand that you would like to know how to set things up from the beginning to the end. We would like to assure you that we provide detailed instructions and guidance on each of our courses. If you need any further assistance, please do not hesitate to contact us at trainings@memcourse.com or by phone.
I really don't understand now a days why trainers wants to use Foreign Language, I have been seeing many, using Foreign Language's make the training contents not bad, but worst.
I don't think this kind English is needed here
Hello vatsalshingala3225, thank you for your comment. While I respect your opinion, I would like to politely disagree. I believe that using correct English is important in all forms of communication, including online platforms like UA-cam. Clear and proper language helps to convey our thoughts accurately and effectively. Thank you for understanding.