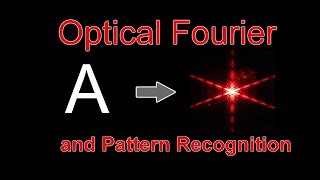
Exploring White Light Interferometry! (WLI / CSI)

Вставка
- Опубліковано 19 тра 2024
- Creating 3D-maps of reflective surfaces using White Light Interferometry (WLI, also known as Coherence Scanning interferometry).
Content:
0:00 Intro
1:43 Building a White Light Interferometer
4:39 About spatial coherence
7:11 Observing interference in white light
10:37 Broad-band radiation interference explained in detail
21:11 WLI Microscope Zygo Newview 100 explored
23:16 Measurement examples
25:44 Michelson and Mireau objectives
26:56 Concave spherical mirror surface (measurement)
27:44 Granite surface structure (measurement)
28:47 Etched glass surface (measurement)
29:32 Turned stainless vacuum part surface roughness (measurement)
The simulations starting from 5:12 have been made using the python script produced by @DiffractionLimited. This code can be downloaded from github.com/0x23/WaveSimulator2D - Наука та технологія


What a privilege it is to have access to such beautiful visualisations and digestible explanations for free. You sir are a very gifted communicator! Thank you for your videos!
My thoughts exactly!
Same here!
Agreed!
If it's free, you are the commodity.
Don't usually comment, but I had to pause after 7 minutes in and say thanks! Those animations explaining spatial coherence are so great. This is an amazing resource, and all the work you put into it is appreciated!
The way you explain all those principles behind methods like this is just so great. I did many experiments with light during my time at university, but questions like "how can you make this light interfere exactly", or why an optical setup was just as it was, often were left unanswered.
This explanation and its connection to spatial coherence is super intuitive and revealing.
Again, a super good video. I think this now is my #1 favourite channel on UA-cam.
About five times through this video I paused it thinking "Oh, that's fascinating! I definitely should like the video to show how much I appreciate it!" only to find I had already liked the video. Wonderful stuff - and your own enthusiasm for this topic shines through, as well as the high coherence of transmission of ideas. Very enlightening.
From my observation seeing all your videos,I noticed that you are taking your viewers doubts into feedback and addressing those in the subsequent videos,glad for that.Thank you
Experiments are the only way to find out how things really work.
The "crude" measurement (63nm) was astonishing! Given the complexity of the machine and software, it would not surprise me to learn that your first value was better. Thank you for making this.
The software is actually not all that complex. What you measure is a movie where every frame represents a well-known delay. Each pixel contains a linear autocorrelation, i.e. the white light interference trace as a function of delay which looks like a pulse. Then, the software determines the exact position of that pulse within the "movie axis" (delay axis), and these peak positions for every pixel directly give you the relative height map. The rest is scaling and calibration. It's actually a nice little exercise for a grad student to code that up in Matlab or something like that.
I doubt it. Remember that he guesstimated the average wave length, no doubt the Zygo device has a better way to determine average wave length. Like correlating the width of the pattern with the (known) displacement of the occular.
@@RealNovgorod Remember this machine is 30 years old. That means the SW was running on a 80486, or, more likely, an early RISC processor like an early model SPARC.
@@TheEvertw So? It's simple arithmetic - at most it may use a Hilbert transform or FFT to precisely measure the relative pulse position, but a crude implementation with FIR filters or some simple thresholding would also work. FFT is very optimized and can run on very old machines without problems as long as the signal length is reasonable. That's what made ancient modem-era speech compression codecs work. Maybe the machine could use dedicated coprocessor hardware for that, but I doubt it.
Just a note: the step height is affected by the phase change on reflection (dissimilar materials: glass and chromium), thus the step is actually a bit higher (I would expect 10 nm more than what was measured)... More details can be found in Zygo webinars - nowadays they can correct for this (in the software, if the material is known).
I nearly forgot:
So much gratitue for having real subtitles! 🙏
Much appreciated.
New Optics Video to start the week! I cant ask for more!
What an excellent video! Do I understand correctly that you want to use broad spectrum light so you have a thin "slice" of your sample? Because this priniciple will still work with laser, but then you cannot discriminate between 1/2 wavelength or 1.5 wavelength, whereas with broad spectrum the more wavelenghts away it gets filtered away?
Yes correct, only with a short coherence length will you be able to identify and relate the correct fringes easily.
I love WLI, and low coherence interferometry in general. Absolute position information down to the sub-nanometer scale.
I applaud you for your description and your ability to get the white light fringes like you did. When we did this experiment in a college lab we had the use of large stable optical tables, very nice optics, nice micrometers, etc. and we still had a large amount of fiddling to do in order to see the fringes. I remember the feeling of great success when I actually got to see those white light interference patterns.
I guess the complication in any environment is people walking around causing vibrations. In this particular setup, the trick to finding the fringes is to first add a bit more tilt and then start searching with the translation stage. This increases your chances of seeing the pattern pass by.
This was cool, exciting and educational!
Fascinating video. I love how well you keep the subject accessible even when talking about such advanced concepts
I did white light interferometry on silicon wafers in an earlier jobs and it was one of coolest things to do..😊 Glad to see that you managed to go all the way upto explaining a Mirau configuration.. This is for sure one of the most informative videos on WLI on UA-cam.
Maybe can you also make a video on confocal microscopy and perhaps compare the two techniques? (WLI and Confocal)
I wish my undergraduate optics lectures had been so easy to understand!
Oh, OK, so that's how you take advantage of frequency diversity. I'm used to radar imaging where our spectral bandwidth relates directly to resolution. This summing of the reference and target signal must somehow equate to our "mixing" (which is a multiplication) of our target and reference signals. Just a wonderful presentation of all of the physics involved... well done. Thanks for taking the time to put this together.
Radar is a form of light with a very long wave length: order of 10 cm instead of tens of nm.
Your visualizations of compex phenomena is unrivalled (and yes, i follow the other greats here)
i am so glad that youtube exists, otherwhise i would never have found out about fascinating stuff like this!
I just wanted to thank you again for approaching every subject as an opportunity to teach, it makes your videos such a pleasure to partake in.
Super late to the party, but wow! What a video! You really outdid yourself with this one, I'm just in awe of how much information and demonstration were shown. I had a general idea about how WLI worked, but now feel like I have enough detail to actually build or troubleshoot one. Great work, thanks as always for sharing your knowledge! ❤
Thanks Zack, you can actually buy these instruments (the hardware) from Ebay, sometimes for relatively little money. However, as I also said in the video, building the software is the real challenge. In order to get to 0.1nm resolution, you need to establish the relation between scanning position and phase within a milli-radian. So it's not just about simply finding a maximum for the interference intensity for a pixel, but rather fitting the data to an expected interference curve. In fact I don't even know how they do it exactly. But it's a very nice (but also niche) technique with fairly limited applicability.
What a gratifying feeling to intuitively know where you are going and be able to correctly predict how the experiment would work but only because I've been following your videos and apparently absorbing knowledge! Thank you.
It's always such a treat when you put out a new video! Thank you very much!
Fantastic video!! Thank you so much for such a beautiful presentation. I love the special effects at 24:14 😁
Schitterende video, Jeroen! 🥰 De simulatie en uitleg van witlicht was erg leerzaam. Kwam toevallig op een goed moment voor me. En gefeliciteerd met dit prachtige apparaat!
Bedankt Nobby, jij ook nog super bedankt voor je ondersteuning bij het debuggen!
Ik ken je niet, maar degene die iemand helpt met het debuggen heeft mijn diepste respect. Dank u wel 🤗
So good ! Its great that you strike such a good balance between accesability and depth in your presentation.
Thanks Manuel. I just looked at you channel, again, you are doing pretty good with the subscriber numbers!
Your explanation and illustration are amazing. A subject can be explained as much as you have done. You touched all the senses we have. Thank you, and keep making more videos like this.
Great content sir, Zygo is one of the best manufacturers of CSI technology. Great thanks from the Zygo Represent team in Vietnam.
Not gonna lie, have struggled with some of the explanations in the past - but adding the manim charts that really intuitively show the fourier breakdowns and interference as the broadband signal shifts is really really helpful. Very very cool.
I’m so glad I found this channel.
Can’t get enough of your excellent videos.
Your channel made the understanding of light very intuitive for me thanks
Always a pleasure to catch one of your videos.
That’s a beautiful instrument. The signal processing math one can do on an array of pixel values is awesome, and a great way to learn math and programming. I built an optical position measurement instrument using a sensor which had one straight line of 1024 pixels, to show where a shadow falls on the array, and used a breadboard hobby chip called Teensy. It’s good for beginners learning how to program, and not slow like the original Arduino learning board.
Another amazing demonstration Jeroen! The Zygo Newview 100 is a seriously cool piece of hardware!
Man, this content is outstanding. Thank you for sharing.
What a wonderful visualisation of the phenomenon. Thank you for making this!
Brilliant!!! I like your 10,000 ft. approach to this topic. Though I think that explaining the fringes would have been easier if you described constructive/destructive interference of the visible spectrum and how that relates to the optical path difference between the part under test, the reference, the focal plane of the objective. Also, it should be added that too much tilt can cause ray trace errors and slope acceptance errors as well. Try to spread the Peak fringe (center fringe) across the entire FOV (aka Nulling), then take the measurement. You can also play around with the Aperture stop to get returns deeper into the bottom of the cavities. Another FYI, the peak wavelength of the Halogen lamp is the industry standard for the high end optical profilometers (white light). So the peak wavelength should be between 540-550nm. Great job on this video.
Really cool to see you cover WLI !!!
thanks for the lecture on CSI, much appreciated.
Bored, you are wild. I will NEVER get bored by whatever you will teach us! Awesome video.
So fascinating, and as wonderfully presented as ever. The visuals combined with narration were especially clear and illuminating in this one. Thank you again!
Makes the 2u work of EUV photolithography even more impressive. As always, love your content. Please keep more coming.
Thank you, one of my favorite channels on UA-cam. What took me days to understand in uni , watching your videos im able to grasp it in matter of minutes.
I hope you continue to make videos. They hold an amazing educational value!
Best wishes.
This is an absolutely fantastic video. Thankyou!
astonishing explanation ! thank you very much !
Thank you for bringing this interesting topic and instrument to the public.
Fascinating, thank you! I have used an FTIR spectrometer and IR microscope for years, but didn’t realize you could use the same interferometry principle for surface height measurements!
An other gorgeous video!!! Many thanks
thank you for your excellent work
Fantastic lesson. Thank you.
Amazing work as always!
I love your videos. I didn't want this one to end
You always have the coolest ideas to show, thanks a ton for sharing!
Thanks, another great lesson!
Fabulous as always
Absolutely amazing, thank you for the great content.
I love how far you've come with your animations and overall visualisations. I worry, however, that Robin Renzetti will have to discard his granite surface plates after seeing this video.
Thanks. There are large differences in the surface quality of granite, depending on the origin / composition, but also because of the method that they were polished. This particular sample was of "tombstone" quality (for graves). The stones you find in mechanical workshops generally don't show multi micron-size height differences.
Be careful when measuring two dissimilar materials, such as metal-glass interfaces as a phase error is introduced. I'll direct you to a paper "Offset of coherent envelope position due to phase change on reflection." Thanks for the cool video(s)!
That is indeed correct, there will be phase shift differences with different reflective metals (including chromium). I decided to leave this out to not further complicate the explanation about how to calculate height differences.
Oh, Your channel is SO interesting! I didn't watch the video yet but I just know it's gonna be good. Keeping it for a dessert.
Thank you so much for sharing your knowledge! :D
Excellent video as always, very clearly explained. It might be interesting use this microscope to a examine a metal surface that has been scraped flat.
On the nanometer level, it will likely look like the Himalayas
@@HuygensOptics Thank you for the response. Indeed, I suppose it would only show the difference between the idea of precision in optics vs machining. I still think it could be interesting, although maybe only with a larger viewed area than achievable even at only 2.5x, at which point using this microscope feels like "using a cannon to kill a fly."
I am relieved in the first half of this video, considering I tried to fully understand this technique in an afternoon, that it is in fact not as simple as I thought.
Another amazing and educating video! Thanks for all the work you've put into this, I always love watching your stuff. Groeten van een amateurtelescoopbouwer uit Rijswijk!
Amazing video & technology.
Amazing how just with some relatively simple components anyone with the know-how could make a device capable of sub-micron measurements. But that software processing the images in the Zygo instrument is something else. The GUI reminds me of the UNIX workstations of the nineties, I wouldn't be surprised if there was one hiding somewhere in the sytem ;-)
Correct, it is ported from UNIX to windows, which is clear from the way you have to close windows or move them around.
Awesome video! you could also look into Optical coherence tomography (OCT) which uses roughly the same principle to "look into" certain materials such as skin or your retina.
I don't have one ;-). Also building one myself would not feasible technically, especially the software.
Oh wow. This is sooo good! 🤗
I even think I understand CSI now. 😲
Brilliantly explained, wonderful visuals, perfect boundary conditions (if you know what i mean 😉)
Thanks so, soo much 🙏
Thank you for this.
Whoa Thanks a lot for this video! This is incredible; your video couldn't be more pertinent to me timewise. I am having trouble at work with telling what are the dimensions and material of micron sized parts and this could actually be a solution.
Plus, as I am only an intern, this is so clear and well presented that I can actually understand it and think of ways to apply it to solve my problem!
Thanks a lot Huygens Optics for sharing your knowledge,
Great video, as usual!
really amazing explanation
I love your description about shifting intensity by a certain number of wavelengths (integer or non integer). It called to mind the fourier transform for me
The interference pattern reminds me of the wavelets used in the wavelet transform.
Typically well explained, thanks again. This is a level above the Foucault test I used on my 6" parabolic mirror. But it works well enough.
cheers from sunny Vienna, Scott
Another awesome video! I'd love to play around with data from something like that machine!
Awesome ! never seen this before and it's fascinating please keep educating !....cheers.
What a fascinating method, very clever and your video made the explanation very approachable! Really neat that "white" light (otherwise often ignored in high precision optical methods) can be exploited by taking advantage of the very characteristics that make it less useful in most other techniques.
13:08 This reminds me of the property that extremely short light pulses necessarily have broader frequency spectrum, which places upper limits on how closely (in frequency) you can pack two optical channels in something like a fibre optic cable while increasing their modulation rate; eventually if you modulate the light fast enough, the two adjacent channels (which have plenty of separation at lower modulation rates) end up smearing over each other.
I seem to recall a previous video I've watched (not sure if one of yours or another creator) that mentioned ultrashort laser pulses and how they're effectively "broadband" and contain all frequencies, which is related to how in audio, they'll often use the impulse response of an audio signal to characterize a given device or environment, because the resulting waveform captures the effect of the device under test across all (relevant) frequencies.
I was waiting for it :) Thank you!
Thank you, very interesting
Great lecture
Amazing!
the graphics to explain how the interference pattern arises and the sums of the two reflected beams are phenomenal
Glad I left it in, initially I thought it was maybe too obvious and long and did not want to use it in the video.
As a hobbyist, i was lucky enough to get my hands on a discarded profiler. Mine was made by Wyco, which was later bought out by Zygo. It was in pretty rough shape, but with a lot of TLC, I have it working, though its completely mechanical - no motors, electronics, or software. The images i can get , white light or monochromatic, are absolutely facinating. Thanks to your presentation, i learned that i have to divide the wavelength by 2 for the real height! (Thanks! Its good to learn something new.) For as beautiful as the images are, id love to be able to obtain any kind of software that could produce the type of height maps your software produces. I haven't found anything free. I have a strong suspicion that my ancient version just doesn't have software support from Zygo. Id appreciate any info on possible software substitutes that could possibly produce those types of depth maps. Anyway, this was a fantastic video presentation - thank you!
Yes, free software for this is impossible to find and commercial software is terribly expensive. My instrument came with a dongle, so I can still use it. But porting to another machine would be very difficult. Hopefully things don't break down soon. Sorry I have no solution for you. Maybe one of the viewers has a solution.
This is awesome! I just build a low coherence interferometer myself and the part showing the phase offsets and how it relates to the intensity distribution was excellent. if you're interested, see the paper "Absolute optical ranging using low coherence interferometry" by Danielson and Boisrobert, I thought the Fourier treatment was clever.
I was just wondering about the effect of illumination bandwidth, and then you said the wider the bandwidth the better the resolution! That makes sense, but I would not have guessed it on my own. It definitely feels like a Fourier transform thing -- having more width in the spectral domain would allow sharper waves in time or space domain.
Hi Ben, the resolution limitations are actually mostly in the accuracy of the scanning with the piezo and being able to relate the scanning position to the interference "phase" in each pixel. To get to the 0.1nm resolution that the instrument has, you have to be able to measure the phase with an accuracy smaller than a milliwavelength. And you cannot do this by just determining where the maximum fringe intensity that you find using a 25 frames per second frame rate. So yes, there is some frequency analysis present in the software. In the case of narrowband radiation, it would actually be easier to measure phase very accurately, but it would be very hard to identify which fringe is which. The latter is way more easy in broadband radiation, because there aren't that many to choose from.
@AppliedScience
Beautiful episode. I suppose this technique was impractical before the age of powerful computers. I have seen examples of holographic photographic analysis of vibrations in macroscopic objects that reminds a lot of this, and it didn't use computers. It reminds of analysis of tension in plexiglass shapes with polarized light.
A new Huygen Video, is it Christmas already 🤩❤
Hey, thank you for the comprehensive explanation!
Please, try to scan a HDD platter
Also, i'd like to see different cleaning solutions residue on a "as flat as possible" surface, so we can see how much stuff get left behind
Microfiber cloth residue would be interesting also
Well, so many possibilites haha
at 27:29 we can see a second, weaker scan of an interference pattern. Why is that?
edit: awesome video as always! I particularly liked the explanation of temporal coherence and the small note that the arms in a white light interferometer need to be exactly the same length.
Wow!
Thanks🙏
I salivate when i see your optics videos - no one is doing a deep dive on the subject
Like discovering Nile Red for the first time
When the two combine, it's like it's doing an autocorrelation with a different offset version of itself. The brighter parts are where the parts were most alike even though they were offset.
just yesterday i thought of writing to you and requesting more videos.. :D
Yep, I decided I'd spare you the trouble (;-).
Hey Jeroen I have just discovered your UA-cam channel and I absolutely love it. I didn't know anything at all about White Light Interferometry but now you have explained it I think it's amazing. Then, by chance, I noticed that Nikhef are talking thinking about plans to use white light interferometry in their gravitational wave inertial sensor pendulum control system. Do you know Nikhef? They may be near you; I wonder whether the Huygens Optics could consider investigating their contribution to the LIGO/ LISA / KAGRA interferometers and then explaining it to us? That would be fascinating.
Awesome❤
Is like seeing continuous wavelet transormation in practice. I wonder if CWT and WLI are somehow related? Also congratulations on your videos. Every video you post is truly inspiring!
Great video! it's such an ingenious technique. Well it gets even more mind blowing with Optical Coherence Tomography. Do look into that, if you haven't already.
It takes the principle to the next level by sort of doing everything the opposite way. Although using the short coherence to localise the interference fringes allows an extremely precise measurement, the range of measurement is necessarily tiny.
Instead, in OCT, a much larger height range can be covered (multiple millimetres) and as the name implies, the system is not limited to measuring the topography of a surface, but can penetrate below the surface to reveal information about the intereior.
This is done by scanning the point of measurement axially, by rapidly varying the length of the reference arm. Light is returned to the interferometer by sub-surface scattering instead of reflection. Ordinarily, sub-surface scattering doesn't give much useful information because light can scatter multiple times and from anywhere within a range of depths, and this creates a "blurring" effect which overwhelms any useful signal once you try to see more than a minuscule amount below the surface.
The genius part of OCT is that by axially scanning the point of measurement, ONLY light that is being directly scattered from a known depth in a single interaction is detected, since otherwise the path length would differ enough to take it out of spatial coherence.
I loved the Heisenberg Uncertainty Alarm
No doubt someone will commercialize this idea and start selling them on Ebay. 😁
Young (1801) demonstrated intererence fringes with white light (sunlight) through a narrow aperture split by an edge, very like your light source here. (I wondered about Young after one of your Coherence vids)
Your stuff feels to me like an amazing glimpse into a distant future of technology. And then Mirau's patent turns out to be from 1949!
Remember that even the machine has a production date 30 years in the past!
Very much similar concept of Optical Coherence Tomography (OCT) used in ophthalmology ;).
very interesting
love it :)
What will happen if there wasn’t a lens before the camera? Seems like we would still be able to observe the interference pattern…
Yes but it would be fuzzy and hard to evaluate. bringing the image into focus is essential for a high resolution height map.
autocorrelation, such a useful concept