ANOVA using R programming

Вставка
- Опубліковано 8 лип 2024
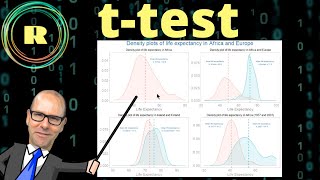
- ANOVA or Annalysis of Varience can be easily done using R programming. If you're learning statistics or data analysis using R, the you'll need to know how to compare the means of three or more variables. ANOVA lets you do that. So, for aspiring data scientists or anyone learning statistical analysis for research, this video is for you. I also include some instructoin as to how to use the TukeyHSE function to establish which variables are driving a difference identified. Remember, your null hypothesis is that all the means are the same. If the p value is less than the Alpha, then you can reject the null hyopthesis and accept the alternative that at least one of them is different. TukeyHSE allows you to identify the variable that is driving that difference. ANOVA is an important component of statistical modeling for anyone interesting in quantitative analysis using R programming.


Get my FREE cheat sheets for R programming and statistics (including transcripts of these lessons) here: www.learnmore365.com/courses/rprogramming-resource-library
Sometimes I really can't believe I'm paying for the education that I am which is only forcing me to look up UA-cam videos like this which are free and actually teach me something and are worth the time trying to follow. Thank you so much.
Wow! So nice of you to say, Tracy - thanks for the great feedback!!
Totally agree
Totally 👍🏾. Massive THANK YOUs for your videos. I’m dreaming R code now 😂
Excellent simplified explanation. Not everyone is gifted to teach but truly you are.
that's very kind of you to say - thanks.
thank-you for uploading new videos! You are by far my favourite R teacher on YT and I know this will come in real handy for me in the future. Thanks!
Thanks for the great feedback!
Thank you, Greg. You are teaching in a very simple and effective way. I am a beginner in using R but only watching few of your videos, I am getting confident to use it for my research.
You are my favorite R instructor. How you explain these steps makes R look so simple like just taking tea and bread. Keep doing it sir. Big up!
Wow, thank you! Cheers!
The timing of this upload is uncanny. Thank you for the clear and concise information.
You are most welcome!
Crystal clear. You are so good at teaching! Thanks.
This actually helped me understand analysis of variance as a whole better , and applying it in R comes in very handy during analysis
Thank you for the feedback!!
Cracking! Definitely enjoying this new series. Thanks for putting it together.
You are most welcome
Splendid as usual. ANOVA is one of the most difficult tetsts. One would loose courage to proceede with statistics if failed with ANOVA. Many thanks and good luck! See you!
Glad you liked it!
At least for this current moment I know about anova... This is very interesting to explore it more.
Thank you for this video lesson!
So nice of you! Glad you liked it!
Saved my thesis, getting significance on the values, thank you :D
You are most welcome.
I'm a big fan of your videos. Thanks for everything.
Thanks for the comment. Glad you like the videos.
Brilliant explanation, thank you. I would really like to know how to create the boxplots and density plots side-by-side as you have them in the video.
This work you do is so amazing. We love 😍 you. You make it so easy for us. You are the best. Big thanks. I would love to work under you in the data world
That's very kind of you to say (thanks for the feedback Nathan!)
Sitted in the same chair same room delivering anova in r after t.test in r am also in same chair same room listening to you Loud and clear here in remote village in africa.the world has become a small small village .After chisquare test please do linear, logistic and poisson regression in r.
Thanks Greg, you're a role model to me..
Thank you very much!!! Cheers
this is amazing, and beyond helpful!
Glad it was helpful! thanks for the great feedback Raquel! 🙌
Well Explained, Thank You for Sharing.
Glad it was helpful!
Very well explained, thanks!
Glad it was helpful!
Thank you for the video
Thanks for watching!
Keep the videos coming Greg! Any chance you can make an advanced video about R project organisation? File structure, sourcing files, code modularity and reproducibility? Im working on a dash dashboard with lots of api providers and I feel slightly lost as the project grows. It would be great to have your take on it.
thank you so much~ it's an useful video. This is exactly what I was looking for.
Glad it was helpful! Thank you for the feedback.
Thanks 👍
Just Awesome😍😍
Thank you for the feedback. Glad you enjoyed it!
Great video, it would also be useful to go through the ANOVA assumption checks
Also, can't wait for hearing you explain functions like for and while
Great suggestion!
Amazing videos
Glad you like them!
Its awesome
My UA-cam subscriptions: movie reviews, game reviews, electronic dance music, motorsports... and R Programming with Greg Martin 👍👍
Haha. Glad I made the list. Thanks for subscribing. Hope you continue to enjoy the channel.
I'm looking forward to the lmer episode with an ordinal fixed effect. Any idea how to do that? Some context: reaction time depends on word perception that was rated on a 7 point scale. Edit: And thanks for this and all the previous videos. You are amazing and a life saver
Thanks for the feedback and suggestion - I'll see what I can do.. :)
would love to see more videos about regression - but with more than one variable being piped into the model
will do :)
Will you eventually make a video on factor analysis? I study psychology and I would really like to learn how to do one.
You'd probably be the best stats youtuber to make it look simple
yes - will do :)
excellent
Many many thanks!
Hi Greg, what is the difference between "Anova" and "multiple t-tests", and which one do you recommend?
When I chose four continents ("Americas","Oceania","Asia","Europe") to do TukeyHSD, I got different p values(e.g.asia-americas: p=0.23 ). Could you please explain that a little bit? Thanks!
This is great stuff as usual.
But... I would have asked the research question first before doing all the data wrangling.
Thanks!
Good point - it is good practice to have a well established research question defined early on
You rock:) Can you please point me to the lesson where you created those beautiful boxplot and density plot with dots representing the mean, color by continent, and line for means for the density plot? I got it as far as creating the boxplot and density plot but unable to color and add the dots and lines for the means
Learning statistics with you is an absolute pleasure.
I have noticed that you neither test the distributions nor variances equality (despite that they look a little skewed).
Are you assuming normality based on the big sample size? Or maybe the groups’ distributions are not skewed?
Brilliant thank you. I don't suppose you might cover logistic regression anytime soon 😃
Great suggestion!
Thanks. Could you please do a tutorial to compare one-way and two-way anova?
Thank you for uploading such an amazing video. How can we make boxplots as you have done?
Hi!
Why we should find a mean and then run anova? Is it a case based on this data type, or it will not be ok to have raw data and run anova based on data replicates?
My thought that anova will count the mean automatically from the data replicates!
Thank you in advance!
Here's a question for you lot. So is ANOVA a pairwise T-test under the hood? Perhaps with some additional maths that create a cumulative p-value? Just curious. I'm just starting out in learning statistics and I haven't yet gotten to these sorts of statistical tests.
Outstanding video. Can you include the code for the really informative graphic used in this video to visualize the data?
hi there - I have the code available for all of these graphics on a Cheat Sheet that you can get at the end of my Data Visualisation video
Awesome vid. Any plans for machine learning videos in the future?
Yes for sure!!
Can an ANOVA test be used on three continuous variables if one is converted into a factor?
Is anyone able to provide the code to the box plot and distribution graphs seen in the video regarding the Life Expectancy between continents.
Hi, follow Saffer here. Thanks for your videos they are really helpful! I had no knowledge of R and now I'm slowly starting to get it. Is there a way to get the scripts you created? Through Github or something?
Does "Don't do drugs." include the abstinence of caffeine?
In that case I'd have a significant problem.
Hello, is someone able to expand on what the %in% command does?
where is the link to the dataset used for this video
excellent video! will you make the script available?
Will try to yes.
thank u for your explanation. I tried to download the cheat sheet but I didn't recieve it.
Hi sorry to hear that, please check your spam folder.
Where can I get the data you're using? Sorry, I'm a newbie here
Anova assumes normality of data, could you please explain why you didnt test that before continuing to anova? how do we know our data is normal ?
whenever I try ANOVA on three groups (America, Asia, Europe), it shows only data of one groups only!!!!!!!!!!!!!! even when I do multiple Hypothesis testingm it shows only one interaction between two groups and not the other interactions!!!!!!!!!!!!!!!!!!!!!!!!!!!!!!!!!!!!!!!!!!!!!!
Hi i share a similar code if someone is looking to do the graphs (sure you can do better but this does the job i think XP ):
gapdata %>%
ggplot(aes(x=continent, y=lifeExp, fill=continent))+
geom_boxplot(show.legend = TRUE)+#, outlier.alpha = 0.5) add if you want to jittering outliers:
geom_jitter(show.legend = FALSE, width = 0.25, shape = 21, color = "black")+
coord_flip()
Ussing ggplot2 to make the graphs with pipes.