I love how this video is 20 minutes long and it felt like 5 minutes. Everything was well explained and it just kept getting more and more interesting. Congrats!
I love your motivation at the beginning! You really hook the viewer with exactly what you're talking about, why it's interesting, and make promises for later in the video. It really kept me watching! In terms of clarity, I also loved how basic you started, letting anyone with even a small knowledge of imaginary numbers and what they are get by and understand the video. I think you could've done with maybe a short reminder of what imaginary numbers are and why were graphing their functions, but other than that it was fantastic. I also love your use of constant examples and animations, which really make sure the viewer is staying with you as your progress through the video. I think a couple of your steps could be more well thought through or explained, such as explaining polar coordinates, but even those were not bad and could be fixed with just a few seconds. In terms of originality and memorability, this was fantastic! I've never seen this covered before, but it's such an important problem with dealing with complex functions. I feel like most people take your first solution for granted when looking at the problem, so it's super interesting for someone to dive into possibilities we haven't considered for such a basic task.
Thanks for the nice comment. Once I started editing and watching the end product I noticed that some parts probably needed some expanding. Mainly the polar form as you pointed out and what does it mean to talk about exp or tan of a complex number. Unfortunately the deadline was looming so I stuck with the original script. Making these videos is also a learning experience :)
My only problem is that without the color circle mapping the angle to the hue on the side, it's hard to understand what the color represents on the graph, as I'm not very used to it. Great video, though, looking forward to learning more that soon
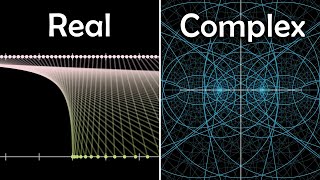
It actually is possible plot a 4D graph, for instance a surface with two parameters, in a 4D space. The solution is exactly what we do with plotting 3D surfaces on a screen. We project it onto a flat screen, and then rotate around in three dimensions to examine different views. You also can take 4D information (the surface), project it to a 2D screen, and similarly rotate around in four dimensions, examining the surface from different points of view in 4D space. For instance one view might show the real output on an axis perpendicular to the xy plane (the z-axis), another view would show the imaginary output on a different perpendicular axis (the w-axis). And you can rotate partially between the two views. The difficulty is interpreting what your seeing, which is a matter practice, but it certainly is possible.
I agree with your introduction, I was actually excited that at least one person was going to mention "true" 4D methods and examples! But then in your examples you relapsed into mere 3D cases (Re, Im...). Are you familiar with "true" 4D complex function graphs? Did you see my comment three days ago, with my links to exactly that? If not, welcome to have an overall look at 4D objects ;)
But there are some easy to understand visual cues helping to understand it, for example animated rotation, shading, perspective projection and functions are usually simple and predicable so when you see spiral in isometric view, you assume it's a spiral. When you see color-encoded heightmap with contour lines and shading which depends much slope faces the north, you have information to read height (color), gradient (density of countour lines) and direction of slope (shadow and color going from green to brown). In 4D there are usually no visual clue and even projection to pseudo-3d on screen with time is not obvious.
I'm a mexican collegue student and i enjoyed the video, i always wanted to understand how to visulize a complex function and this is the first video that explain it well.
I love domain coloring, I used in a paper to visualize complex numerical solutions to a differential equation and people loved it too :) not only can you immediately see all poles/zeros/essential singularities/branch points immediately, but you also see the order of such just by seeing how many times the hue changes around a point Mathematica has a beautiful color function to visualize contour lines and at the same time lines of constant real/imaginary parts that I found the most complete
Why doesn't anyone plot these like a vector field? Those plots often put little 2D vectors at points all over the domain. For many functions I think this provides a nice combination of accurate and intuitive.
This is a good way to plot the functions! But at points where the function value is very large, the arrows become too long and everything starts being messy.
Had to do that for an exercise once. It's helpful to see how a complex function transforms the complex plane. Only reason I don't keep on doing it is because it's tedious, but it's a good way to build intuition around what functions should look like.
A common 4th dimension is time, so the graph could also be a movie that dynamically shows how input leads to output. Wave patterns are often shown like that, because the input is repetitive.
just one criticism: 16:31 you say that the graph of 𝑓(𝑥) is {(𝑥, 𝑓(𝑥)) ∀ 𝑥 ∈ ℝ} when in reality that only counts as the graph of a function 𝑓(𝑥) with domain ℝ, but not for any function whose domain doesn't span all real numbers. for the rest, the video is an amazing learning tool, hope you the best!
9:40 So if I start at origin,(blackness) and walk right on red I'm in positive real number territory and walking left on cyan I'm in negative real number territoy; I don't understand why the yellow line represents 'positive' imaginary number (it is below real line) and purple represents 'negative'?(it is above real line) why is this the convention? Super nice video. Really makes the 4-d concept make sense. Thanks for your work.
The function is z/(z^2 + 1), so for large z it is pretty much 1/z = z*/|z^2|, so the imaginary part gets flipped. So the real and imaginary axis of the domain are oriented as usual, but the function flips everything (Note that close to zero, yellow-green and purple are as you'd expect)
The i, j, k coordinates play a similar role. So I think nice way of visualizing a quaternion would be use 3 spatial dimensions for these coordinates and color or some other visual cue to represent the real part of the quaternion. Quaternion valued functions are definitely a thing, but would be even trickier to visualize (you need to squish 8 dimensions of information somehow and even the graph projections would be 4d)
At 9:44 I would have expected the green line to have a negative imaginary part and the purple line to have a positive imaginary part. These are flipped in the narration. Not sure if my expectation is wrong or the narration is wrong
The function is f(z)=z/(z^2+1), so for example f(2i)=-2i/3. As the imaginary part grows f->0 but always with negative imaginary part. Another way of seeing this is that when z is large f(z)~1/z=z*/|z|^2, so that's why f(z) and z end up with imaginary parts with opposite signs. Looking back it may not be the best first example from a pedagogical point of view, since I had that mixed up in the text and picked it up during recording.
Just plotting the argument of the value when domain coloring gives enough information to work out the entire function up to a scale factor, as long as the function is differentiable.
Pretty much what I am saying in a round about way. Except I'm relating this to electro-magnetic light. You can represent your colors in two ways, potential energy or kinetic energy. The cone is a special case of kinetic energy when mass is zero. Potential energy is the flat disc but only when when there is mass (numbers between -1 and 1 on output can't be included). If there is mass, potential energy has a small lip on the edge. I have to make my own graphing calculator, I guess. If I want it done right. When kinetic energy has mass, it is a hyperboloid. If the mass is negative, it is potential energy. If the mass is positive, it is kinetic energy. At least that is my theory this morning. I'm going to fudge with the numbers and try to verify it.
thank you for the explanation, even though this is really a good video I still have a hard time to understand this, maybe because I'm still in high school
Is this a collaborative project between a graph author who lives in the U.S. (spelling "color") and a narrator who lives in another country (calling Z "zed"?)
A graph is just a set of input and output coordinates? So I guess that means that domain colouring _is_ a true graph of a ℂomplex function. It's a set of points (x, y, |f(x + iy)|, arg(f(x + iy))). Those last two coordinates then actually get mapped _up_ a dimension so technically it ends up as a _5_ dimensional graph used to plot a 4 dimensional function. Adding the height makes it a total of 6-dimensional, though with said dimensions not all be linearly independent, and then it gets projected down to 5-dimensions anyways in order to display on a flat screen. People talking about it being "impossible to plot a 4D graph" really do often forget that even their "2D graphs" are ultimately 5 dimensional, though it is true that the redundancy and less dense information can make it much easier to interpret.
Once, I was playing with Geogebra on my phone with complex function and got one ovel-like function I liked it so much I took a screenshot (with out axis) Now it's my profile picture but I forgot what the function was. 😂


I never fully grasped why four dimensions were needed for complex functions, but the way it was explained here finally made it click
Skill issue
@@muffinconsumer4431 lol
I was only used to read that in FutBin comments lmaoo@@muffinconsumer4431
2 inputs 2 outputs
Love myself some #SoME3 in the evening.
Love myself some #SoMe3 in the morning too.
This has to be one of the clearest explanations from a SoME3 submission. Great work!
I love how this video is 20 minutes long and it felt like 5 minutes. Everything was well explained and it just kept getting more and more interesting. Congrats!
I love your motivation at the beginning! You really hook the viewer with exactly what you're talking about, why it's interesting, and make promises for later in the video. It really kept me watching! In terms of clarity, I also loved how basic you started, letting anyone with even a small knowledge of imaginary numbers and what they are get by and understand the video. I think you could've done with maybe a short reminder of what imaginary numbers are and why were graphing their functions, but other than that it was fantastic. I also love your use of constant examples and animations, which really make sure the viewer is staying with you as your progress through the video. I think a couple of your steps could be more well thought through or explained, such as explaining polar coordinates, but even those were not bad and could be fixed with just a few seconds. In terms of originality and memorability, this was fantastic! I've never seen this covered before, but it's such an important problem with dealing with complex functions. I feel like most people take your first solution for granted when looking at the problem, so it's super interesting for someone to dive into possibilities we haven't considered for such a basic task.
Thanks for the nice comment. Once I started editing and watching the end product I noticed that some parts probably needed some expanding. Mainly the polar form as you pointed out and what does it mean to talk about exp or tan of a complex number. Unfortunately the deadline was looming so I stuck with the original script.
Making these videos is also a learning experience :)
My only problem is that without the color circle mapping the angle to the hue on the side, it's hard to understand what the color represents on the graph, as I'm not very used to it. Great video, though, looking forward to learning more that soon
It actually is possible plot a 4D graph, for instance a surface with two parameters, in a 4D space. The solution is exactly what we do with plotting 3D surfaces on a screen. We project it onto a flat screen, and then rotate around in three dimensions to examine different views. You also can take 4D information (the surface), project it to a 2D screen, and similarly rotate around in four dimensions, examining the surface from different points of view in 4D space. For instance one view might show the real output on an axis perpendicular to the xy plane (the z-axis), another view would show the imaginary output on a different perpendicular axis (the w-axis). And you can rotate partially between the two views. The difficulty is interpreting what your seeing, which is a matter practice, but it certainly is possible.
I agree with your introduction, I was actually excited that at least one person was going to mention "true" 4D methods and examples! But then in your examples you relapsed into mere 3D cases (Re, Im...). Are you familiar with "true" 4D complex function graphs? Did you see my comment three days ago, with my links to exactly that? If not, welcome to have an overall look at 4D objects ;)
@@wugionyoutube Can you provide those links here? sounds fascinating.
But there are some easy to understand visual cues helping to understand it, for example animated rotation, shading, perspective projection and functions are usually simple and predicable so when you see spiral in isometric view, you assume it's a spiral. When you see color-encoded heightmap with contour lines and shading which depends much slope faces the north, you have information to read height (color), gradient (density of countour lines) and direction of slope (shadow and color going from green to brown).
In 4D there are usually no visual clue and even projection to pseudo-3d on screen with time is not obvious.
only once did my teacher visually show the complex region on the white board, but this video helped it explain what it looks like. cool!
I'm a mexican collegue student and i enjoyed the video, i always wanted to understand how to visulize a complex function and this is the first video that explain it well.
I love domain coloring, I used in a paper to visualize complex numerical solutions to a differential equation and people loved it too :)
not only can you immediately see all poles/zeros/essential singularities/branch points immediately, but you also see the order of such just by seeing how many times the hue changes around a point
Mathematica has a beautiful color function to visualize contour lines and at the same time lines of constant real/imaginary parts that I found the most complete
my colorblindness going wild on this one lmao
😂😂😭
thanks for putting this together. Wonderful explanation.
Absolutely incredible video! Truly 3blue1brown level
Now that's some high praise :D
Why doesn't anyone plot these like a vector field? Those plots often put little 2D vectors at points all over the domain. For many functions I think this provides a nice combination of accurate and intuitive.
I really never heard of this. It'd be like plotting an R²->R² function, so it should work.
That's how i do it, actually. It's a great way of graphing a function on the complex plane.
This is a good way to plot the functions! But at points where the function value is very large, the arrows become too long and everything starts being messy.
Had to do that for an exercise once. It's helpful to see how a complex function transforms the complex plane. Only reason I don't keep on doing it is because it's tedious, but it's a good way to build intuition around what functions should look like.
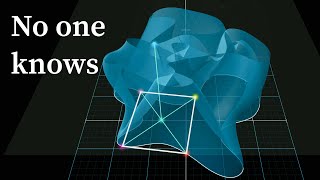
10:35 looks like 3 quarks forming into a baryon
Literally the best video I've seen about this.
never could've imagined that by simply taking the sqrt(-1) we would ever get to 4 dimensions.
Excelente vídeo, professor! 😁
A common 4th dimension is time, so the graph could also be a movie that dynamically shows how input leads to output.
Wave patterns are often shown like that, because the input is repetitive.
Fascinating video, this explained everything in a way that i could understand, and I haven't even gone through calculus yet. Please make more videos!
Crazy interesting videos. Its gonna be so nostalig if future me sees this after having pursued a career of mathematics
This IS parametric architecture. Complex calculus and complex analysis should be requisite for architects.
You explained it perfectly, I understood Everything!
just one criticism: 16:31
you say that the graph of 𝑓(𝑥) is {(𝑥, 𝑓(𝑥)) ∀ 𝑥 ∈ ℝ} when in reality that only counts as the graph of a function 𝑓(𝑥) with domain ℝ, but not for any function whose domain doesn't span all real numbers.
for the rest, the video is an amazing learning tool, hope you the best!
Such a concise and well explained video!
Morbius equation is a zeta function
9:40 So if I start at origin,(blackness) and walk right on red I'm in positive real number territory and walking left on cyan I'm in negative real number territoy; I don't understand why the yellow line represents 'positive' imaginary number (it is below real line) and purple represents 'negative'?(it is above real line) why is this the convention?
Super nice video. Really makes the 4-d concept make sense. Thanks for your work.
The function is z/(z^2 + 1), so for large z it is pretty much 1/z = z*/|z^2|, so the imaginary part gets flipped. So the real and imaginary axis of the domain are oriented as usual, but the function flips everything (Note that close to zero, yellow-green and purple are as you'd expect)
i hope not winning anything from some3 doesn't discourage you i loved the content and you should definitely make more videos
I do have ideas for more. Just need to find time
2:15 why is the domain a unit circle and not the whole plane? or you're just showing how that circle maps
Showing how the circle maps. Mapping the plane is when we look at the grids.
It was so original! though I have to watch this few more times to understand better
Gotta watch 24h version of spinning chip now
With the "spinning seal" song in the background
This is so great. Subscribed 😁👍
Btw, how would you approach plotting quaternions? Are quaternion valued functions a thing even?
The i, j, k coordinates play a similar role. So I think nice way of visualizing a quaternion would be use 3 spatial dimensions for these coordinates and color or some other visual cue to represent the real part of the quaternion.
Quaternion valued functions are definitely a thing, but would be even trickier to visualize (you need to squish 8 dimensions of information somehow and even the graph projections would be 4d)
@@mathematimpa interesting 🤔 😊
Outstanding discussion!
Great ! What tool used for visualization / rendering ?
This was all done with matplotlib (for the 2d stuff) and mayavi (for the 3d stuff)
@@mathematimpa care to share code ?
I uploaded the file to github:
github com/mathematimpa/complex-visualize
I was hoping at the end you’d plot ln(a) so we’d see the multiple layers!
Multivalued functions are a whole other can of worms. Would take a separate video to do them justice.
At 9:44 I would have expected the green line to have a negative imaginary part and the purple line to have a positive imaginary part. These are flipped in the narration. Not sure if my expectation is wrong or the narration is wrong
The function is f(z)=z/(z^2+1), so for example f(2i)=-2i/3. As the imaginary part grows f->0 but always with negative imaginary part.
Another way of seeing this is that when z is large f(z)~1/z=z*/|z|^2, so that's why f(z) and z end up with imaginary parts with opposite signs.
Looking back it may not be the best first example from a pedagogical point of view, since I had that mixed up in the text and picked it up during recording.
You just earned a subscriber
Very insightful video. Can you tell the software you used so i can use it and get better understanding of the visualization?
This was all done in python. I uploaded the file (in all its uncommented glory) to github:
github com/mathematimpa/complex-visualize
God bless you
Awesome lecture
Realize the cyclic nature. The “complex plane” is a projection, of a spiral, and the speed of the spiral is an additional dimension.
Just plotting the argument of the value when domain coloring gives enough information to work out the entire function up to a scale factor, as long as the function is differentiable.
Pretty much what I am saying in a round about way. Except I'm relating this to electro-magnetic light. You can represent your colors in two ways, potential energy or kinetic energy. The cone is a special case of kinetic energy when mass is zero. Potential energy is the flat disc but only when when there is mass (numbers between -1 and 1 on output can't be included). If there is mass, potential energy has a small lip on the edge. I have to make my own graphing calculator, I guess. If I want it done right. When kinetic energy has mass, it is a hyperboloid. If the mass is negative, it is potential energy. If the mass is positive, it is kinetic energy. At least that is my theory this morning. I'm going to fudge with the numbers and try to verify it.
thank you for the explanation, even though this is really a good video I still have a hard time to understand this, maybe because I'm still in high school
Can I know what programs you use for such video creations and thx
This was all python, there is some information in the description.
You got my sub just for simple "hope you liked bye"
As someone with mild protean RG ‘color blindness’, the function colors without contours don’t perfectly match the contours 😂 @10:10
The Re(f(z)) graph being colorblind friendly is a plus I didn't got in.
Is this a collaborative project between a graph author who lives in the U.S. (spelling "color") and a narrator who lives in another country (calling Z "zed"?)
A project by a Brazilian that learned English from British people, but I try to keep my spelling more American XD
A graph is just a set of input and output coordinates? So I guess that means that domain colouring _is_ a true graph of a ℂomplex function. It's a set of points (x, y, |f(x + iy)|, arg(f(x + iy))). Those last two coordinates then actually get mapped _up_ a dimension so technically it ends up as a _5_ dimensional graph used to plot a 4 dimensional function. Adding the height makes it a total of 6-dimensional, though with said dimensions not all be linearly independent, and then it gets projected down to 5-dimensions anyways in order to display on a flat screen.
People talking about it being "impossible to plot a 4D graph" really do often forget that even their "2D graphs" are ultimately 5 dimensional, though it is true that the redundancy and less dense information can make it much easier to interpret.
Is this available in 3Blue1Brown's Python package?
It's not on Manim. This is all matplotlib and mayavi.
@@mathematimpa thank you!!
Once, I was playing with Geogebra on my phone with complex function and got one ovel-like function I liked it so much I took a screenshot (with out axis)
Now it's my profile picture but I forgot what the function was. 😂
My avatar is a bit similar, but I was toying in a fractal generating program.
Mine is the complex "Circle-Hyperbola" w=1/z. With Graphing Calculator 4, the only I know to offer "true 4D".
amazing!!
what software do you use to graph these?
This was all python. I added some info in the description.
I thank God and then I thank UA-cam for recommending this amazing icon to me
((Free Palestine))
very very interesting! we find fractal equations...
if you think imaginary numbers are insane, wait until you hear about quaternions
id you think quaternions are insane, wait until you hear about octernions
if you think octernions are insane, wait until you hear about polyternions
I need your help
Yes
so z^2 is a potato chip
nice to know
z^2 is a pringle chip change my mind
Tw0 dimesion qua cubed
POV: You are Colour-Blind
At least the graph of Re(f(z)) is still usable
Wow this looks really complex 🤣🤣🤣🤣🤣🤣🤣🤣🤣🤣🤣🤣🤣🤣🤣🤣🤣🤣🤣🤣🤣🤣🤣🤣🤣
pringle
This will kill me
Rip Name-xd1hv
I am the 48th comment
you don't know what you're talking about