Tableau Dashboard from Start to End (Part 2)| HR Dashboard | Beginner to Pro | Tableau Project

Вставка
- Опубліковано 6 вер 2024
- Part 1 - • Tableau Dashboard from...
Video tutorial on How To Design the Background for Dashboard - • How to Design Beautifu...
Download data for dashboard - docs.google.co...
📱Book a 1:1 Call with me (Career Guidance, Mock Interviews, Resume Review, etc.) - topmate.io/dat...
📱For Important Data Analyst Materials and Other Resources - topmate.io/dat...
📱Follow me on Facebook - www.facebook.c...
📱 Follow me on LinkedIn - / swapnjeet-s-58a673273
⭐For Tableau, Power BI and Excel Projects contact me on my mail id or WhatsApp number mentioned at the end of description box.
Background Template Download- docs.google.co...
Steps to Download Data and PPT- 1. click on the link 2. go to "File" menu 3. click on download
#tableau
#tableaudashboard
#dashboard
#tableaudesktop
#dashboarddesign
⭐Data Analyst Material available at very minimal cost of Rs. 999. This will include a complete Data Analyst Syllabus with video links, important pdf's, Q&A, this will also include Complete project on Excel (2 Projects), Tableau (2 Projects) and Power BI (1 Project). And the projects will be different from that uploaded on You Tube. If you are interested to buy contact me on my mail or WhatsApp.
For More info watch this Data Analyst Roadmap 2.0 video - • Data Analyst Roadmap 2...
Details mentioned below-
email- swapnjeet555@gmail.com
WhatsApp - +91 9579005495
This Tableau tutorial will take you to the tableau environment where we can have your data transformed and cleaned, then load it to the tableau environment for further analysis and and build the dashboard
In this Tableau Video tutorial, we will create HR using a report/dashboard with the flat file i.e. excel file.
Tableau will help you create advance reports and dashboards. To create interactive and advanced reports and dashboards.
Checkout my other dashboards designed in Tableau, Power BI and Excel below-
Tableau Dashboard-
Ecommerce Sales Dashboard - • Build Tableau Dashboar...
IPL Dashboard - • Tableau Dashboard | IP...
Customer Complaint Dashboard - • Tableau Dashboard | Cu...
Power BI Dashboard
HR Dashboard - • Power BI Dashboard fro...
Excel Dashboard
IPL Dashboard - • Excel Dashboard (Hindi...
Ecommerce Sales Analysis - • Dynamic Excel Dashboar...
Tableau Material available-
1. Tableau hand written notes
2. Tableau printed notes
2. Tableau important formulae print notes
3. Tableau important interview questionnaire
All these are available at a very minimal cost of Rs.200 only, if you are interested to buy please ping me on WhatsApp
Reach out to me for any personal or Business related Dashboard/ Report development on my email- swapnjeet555@gmail.com
WhatsApp on - +91 9579005495
tableau dashboard start to end,tableau dashboard,start to end dashboard development,tableau project start to end,tableau dashboard design,how to make tableau dashboard,how to make a dashboard in tableau,tableau dashboard design tips,tableau dashboard for beginners,tableau dashboard tutorial,how to get tableau dashboards,how to design a tableau dashboard,how to create kpi dashboard,tableau dashboard exmaple,tableau project from start to end,dashboard
Tableau Dashboard,
Sales Dashboard,
Data Visualization,
Data Analytics,
Data Insights,
Business Intelligence,
Data Presentation,
Data Exploration,
Data Reporting,
Data Analysis,
Dashboard Design,
Tableau Tutorial,
Data Visualization Tutorial,
Data Dashboard Creation,
Data Manipulation,
Data Interpretation,
Data Representation,
Interactive Dashboards,
Data Discovery,
Tableau Tips and Tricks,
Data Insights Tutorial,
Data Storytelling,
Visual Analytics,
Business Data Visualization,
Tableau Data Prep,
Data Visualization Techniques,
Dashboard Best Practices,
Tableau Data Analysis,
Tableau Data Visualization,
Tableau Data Exploration,
Tableau Data Reporting,
Data Dashboard Design,
Tableau Tips,
Tableau Tricks,
Data Visualization Examples,
Dashboard Creation Tutorial,
Tableau Charts,
Tableau Graphs,
Data Display,
Interactive Data Visualization,
Data Dashboard Walkthrough,
Tableau Walkthrough,
Dashboard Layout Design,
Data Filtering,
Data Aggregation,
Data Presentation Techniques,
Tableau for Beginners,
Data Interpretation Tips,
Data-driven Decisions,
Tableau Visualizations


Background Design Full Video - ua-cam.com/video/IOzvRueiYi8/v-deo.html
Recently i have changed my domain from Banking to IT , I have watched so many videos related to Tableau at the end I am not satisfied and not enjoying tableau but after watching your videos I have started enjoying the things and craving to learn tableau to become expert. I never comment any videos but you are talent force me to write the comments.
If you have banking domain experience, why don't you think related ERP to learn. it will give good opportunities to you.
Can i know about where you reached after 7 month??
Possibly the best tableau tutorial I've seen so far. Very straightforward and professional. Thank you.
Glad it was helpful!
@siyabongampengu2451 Honestly I just followed the video step by step and the design I just created, who would believe I am a newbie who is just getting to know Tableau for the first time.
Agreed
Thank you so much for your clear and helpful sharing! I followed your instruction and made my first dashboard! How amazing it is!! Thank you again :)
This is great! Very well explained, I could follow along step-by-step with no issues whatsoever and practice my dashboard with Tableau. Thank you a zillion!
Glad it helped!
Thank you soo much for this step by step explanation with such patience and calmness u teach. this is my second ever project and i m soo soo happy after the completion of this. all these colors are soo beautiful. thank u soo much. great work u r doing .
I was always having fear how tough working on tableau would be but after seeing your video it makes me feel more comfortable doing work in this tool.. Thanks a lot and create more such videos on calculation specially fixed one as that is little tricky
Glad you liked it ✨
Wonderful. I've built my first Dashboard by watching this
video. Awesome
Thank you for making this journey easy for me 😊
Sending love from Nigeria 🇳🇬
You are the best teacher which I found on UA-cam on Tableau all things you thought in few hours
Wow, thank you!
It's absolutely helpful watching this tutorial. I gained a lot of knowledge with practicing the same thing which is being shown in the video.
Very very grateful for this content.
Glad you liked it ✨
Hi bro, Your presentation style is simply superb, making complex concepts easy to understand.
Your clear and concise explanations have truly enhanced my learning experience.
Thank you for sharing your expertise and making the subject matter so accessible.
This channel is a treasure. Great video with step by step instructions. Any chance we can get the insights you pulled and how would you present them in your Readme file in a portfolio?
Thank you for being detailed and clear. I should also add that your sound quality is superb and it makes a BIG difference from many other videos
Thank you very much for this tutorial. Made simple and easy to understand. One of the best I have seen so far on dashboards. God bless !!
Glad you liked it ✨😊
WOW, thanks so much! I've watched a few tableau videos trying to learn some basics and this by far is the best one. I actually made my first dashboard 😁 You're the first video I came across that showed me the filters and bins too.
Glad it was helpful!
Simple steps explain to creat beautiful dashboard very clear .. thanks
Thanks for watching
Thanks man! This is very well understood. Could you please do a video on data cleaning in tableau desktop? Thanks once again.
U RE THE BEST.. TANK U for the BEST TABLEAU TUTORIAL
This just made my day. It's simple to follow along and looks far more impressive in my portfolio than the first projects I've done. Thank you!
Glad it helped!
One of the best videos about making Tableau Dashboard. Your attention to detail is inspiring. Thank you. I have learnt so much from these two parts. Thank you so much.
Glad you liked it ✨
Simple, neat, and very easy to understand your explanation was very good and it was in layman's terms the person who doesn't know what is tableau also can able to understand this
Thanks for watching!
Thank you very much for making these concepts very easy and interesting 36:14
Thank you very much for this tutorial! I needed a tableau refresh tutorial for a work project and now I am confident and know exactly what to do! Keep the great work!!
Awesome tutorial. I have followed along and completed the dashboard. Thanks for your efforts in making the video sir!!!
Glad it helped
Excellent! This tutorial is hands down one of the easiest to follow specifically for HR data that I've come across. Thank you!
That's one of those easy tutorials to follow, thanks for the content on Dashboard making.
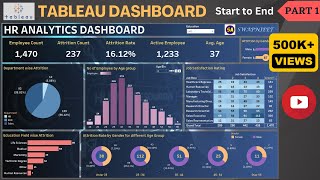
04:32 Designing a pie chart to visualize department-wise attrition
09:04 Designing legends, formatting pie charts, and creating a frequency chart.
13:36 The chart shows the number of employees in different age groups.
18:08 Designing a heat map chart or matrix chart
22:40 Designing and formatting a chart in Tableau
27:12 The video covers designing a job satisfaction rating chart, a bar chart, and a pie chart for attrition rate analysis.
31:44 Convert pie chart into donut chart using Tableau
36:15 Designing a Tableau HR Dashboard with steps
Thank you!! I have done it! Thank you for sharing you knowledge, this is the second dashboard I've recreated from your channel. Cheers!
Glad you liked it ✨
❤❤ i did it and it turned out really nice dashboard thankyou so much..for ur efforts
Most welcome 😊
Thank you for such a great lesson. You are amazing sir!
Dedication + + + + +
Knowledge + + + + +
Passion + + + + +
Teaching + + + + +
Thanks for explaining in an easy manner without hurry
Thank You So Much I just finished making my first dashborad. God Bless You.
You are legend for me bhai....thank you for your effort
saved my life ty
Found this video extremely useful. Great work!
Glad it was helpful!
Excellent tutorial... easy and clear very helpful thanks
Great man of the field! Thank you for your neat content and inviting presentations. Born to teach!!!
Thanks for support ✨
thank you!! the video is very useful with many tips and easy to understand
Glad it was helpful!
Incredible, I learned soo much!!
Glad it was helpful!
Thank you for this tutorial. Very clear and inspiring
Glad it was helpful!
Thank you and i hope in the future you will do others dashboards in Power BI or Tableau.
I love both.
I already have a power BI video for same dashboard, please check in playlist. Thanks for watching
@@datatutorials1 I have see it.thank you
It's really nice video, nice explanation for each and every step.
Thank you very much. Was well detailed and help cleared some doubts I had about how to go about building my dashboard.
Thank you for this content, I have made the same one. Great Learning.
Thank you sir for an amazing tutorial of this kind. Your explanation and knowledge is awesome. Thank you for taking time to design on the go and explain. Very helpful for people like me.!! Keep up the good work.
Wow, Cool Design for a Dashboard 🔥🔥🔥🔥🔥🔥🔥. Thank you for your tutorial, Bro...
Glad you like it 😊
This is exactly why AI can never replace real data analysts, dashboards and data story telling is about art, not just numbers, and AI maybe smarter At calculations, but it will never surpass the creativity of mankind’s art.
Data visualization is an art form.
thx you sir for this step by step explanation
Good effort.Simplified explanation..
Glad you liked it ✨
This is a resourceful tutorial, I have a learnt a whole lot from this.
Wonderful explanation and hats off to your dedication to each detail🙌🙌
Thank you so much, well explained and I have replicated the same.
Glad you liked ✨🙂
Thank you very much for this tutorial
Glad it was helpful!
Thanks a lot...it's really very helpful...beautifully explained
This was a good section. Thanks very much. Just that in the latter part you seem to be too fast. But it was a great Tutorial!
This was a good refresher and practice for me. Thank you so much for this video!
Thank you, I followed you step by step and learned new things.
Very simple and nice explanation thank you 😊
Glad you liked
It been a good learning
Thank You
Thank you for this project is very beautiful design ! can you explain in tableau after 14 days evaluation the project a create is remove or not? . Thank you
Thank you for the guided tutorial
I can’t say enough ‘thanks’ to you ❤🙏🏻
Very Good and Informative.
Glad you liked it
Loved it ! Only 1 query, when we click Either male or female as filter, the donut chart values gets distorted. Is there a way to make it better?
Did you solve this issue?
Very Helpful..
THANK YOU SO MUCH FOR THIS GREAT TUTORIAL...Hands down your tutorial is the best one I have gone through. You helped me and a lot of other people. I subscribed to your channel!
Just curious about the variable "CF age band": was it already in the dataset, or did you create a calculated field for it? Do you have any video where you show how to create such a variable? Thank you so much
Great Tutorial!! Thank you for this.
thank you for creating this tutorial, it helps me a lot to learn tableau
Absolutely loved the tutorial
awesome teacher
Glad you liked it
Thank you this wonderful explanation
Thank you so much
when you placed the pie chart it was already small and u resized it as well...mine is taking half of the dashboard and its not resizing as well can u please help? i followed the steps as u said but its not working for me idk why :(
edit: just found what was wrong...that option below tiled and floating...mine was selected as tiled hence it was not adjusting as i wanted...leaving this comment here in case anyone else is facing the same issue...kindly select floating option below
Excellent Explanation and perfect content learned many new things
SUPER BROTHER
very nice,thanks sir
Very beautiful and educative. Thank you so much
Quality tutorial, learned loads. Many thanks!
thanks for making such kind of videos
thank you for the great learning session.
Glad you liked it ✨
Learnt a LOT!!
Thanks a ton boss
Thanks for watching
Superb Sir Looks amazing and Explanations were really Clear 🤗👌👍
Thank you
Thankyou so much , it was very helpful !
Glad you liked it ✨
Here I have a doubt in "No Of Employees By Age Group" why are you considering "Employee Count " ? Can we go ahead with "Active Employee" ?
Really Grate Sir.Thank u soo much👏
keep it up...want more of data analytics projects from u
Keepit up Your tutorial is so amaizing ....thank you so much for your time and dedication!
This was awesome! Thanks for sharing this !
Glad you liked it 😊
How would you go about doing the pie charts with the age bins by gender in power bi?
Such a amazingly explained..learn a lot from this video..looking forward for more information from you..recommended your channel to all my friends who are learning tableau..
I learnt a lot. thank you😎
Excellent!! so useful and informative.. Thank you
I am unable to see filter option such as department or education. Can someone help me?
Nice viz, hat off for details explanation.
Thanks for watching
Very useful. Thank you sir
Best explain
Learned a lot! Thank you so much :)
Bhai..must do a tableau dashboard for football world cup