I have done 2 3 courses on Tableau of the specialization but it didn't involve butterfly chart and donut chart. So looked up on internet and found this! Very crisp, fast, to the point and great dashboard!
Nice work. One suggestion: as cool as that red-green diverging color scale looks on your map, our color blind friends would not be able to read that map. Better to use the orange-blue diverging color scale. I learned about that when one of my students told me he was color blind and couldn’t make out my examples.
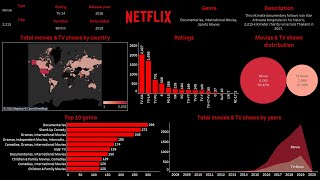
Super useful tutorial on tableau tools. I want to highlight that while working on the first sheet, tableau takes by default setting of the country from your pc and might not display the totals on map but shows "unknowns" at the bottom. In case anyone experiences this, you can click on "unknown" at the bottom right and change the field country to United states at per the data.
was looking for a video which could help me with different chart ideas for Tableau dashboards, and found the video at the right time. Video covers different,interactive chart designs explained in very easy steps. Found it very useful and have bookmarked for future reference too..Thanks for this video.
Hy! watching this before 1 hour submission of my data tableau assignment and gotta say you are saving lives out here! this video covered all the basics one needs to start right awayy! Love you man! Thank you soo much!! i wish u wld teach all the subjects in this world! you make it soo understandable! Thank youu!
WOW I'm just shocked at how you made me look at Tableau in a different way. I used to hate it cos I did not understand it and I'm pursuing a Data analysis career. Thank you very much, I just subscribed hoping to see many great videos like this one.
Very well explained. I have never used this before, but after watching your vid, I feel like I learned so much already. Thank you for taking the time to put this vid together. I look forward to seeing more.
Bro, started a new job using tableau, still up to speed like they want, your video was the best/well put together video I have come across so far, subbing for sure!
Would highly highly recommend learning LOD calcs, table calcs, order of operations (understand context filters), parameters and dashboard actions. You should then be all set. Congrats on that new job and good luck :D
@@stanley.george.joseph that's crazy, my co-worker just told me to learn this before he left the office today. Do you have any recommendations like videos, courses, ect that I can learn LOD? Thank you so much for the recommendation, I greatly appreciate it!
Great Job Stanley. Especially loved the breakdown of how to approach a dataset which is the starting point for any analysis. I had never thought of using a butterfly chart but will start using it now. All the best!!!


My brother, that was amazing. The quickest it has taken me to follow a dashboard tutorial as complex as this. Thank you so much.
I have done 2 3 courses on Tableau of the specialization but it didn't involve butterfly chart and donut chart. So looked up on internet and found this! Very crisp, fast, to the point and great dashboard!
Nice work. One suggestion: as cool as that red-green diverging color scale looks on your map, our color blind friends would not be able to read that map. Better to use the orange-blue diverging color scale. I learned about that when one of my students told me he was color blind and couldn’t make out my examples.
I never knew that. Thank you very much for your valuable comment, I'll definitely keep that in mind.
@@stanleygeorgejoseph Hi Nice Video. Please can I get a link to the dataset you used
@@igbinobaosaigbovo6493 its in the description
I also just learnt that from the Udacity Marketing Analytics course.
Wow I never knew this.. that's a bunch
Super useful tutorial on tableau tools.
I want to highlight that while working on the first sheet, tableau takes by default setting of the country from your pc and might not display the totals on map but shows "unknowns" at the bottom. In case anyone experiences this, you can click on "unknown" at the bottom right and change the field country to United states at per the data.
Awesome!!! Thanks
hey are you getting any null values detected in revenue per month for sep 2021?
@cryscool10, Thank you for explaining this, I was stuck until I read your comment and that got it sorted.
@@stikon650Yes, I got null values, were you able to sort it?
Thanks...that helped
was looking for a video which could help me with different chart ideas for Tableau dashboards, and found the video at the right time. Video covers different,interactive chart designs explained in very easy steps. Found it very useful and have bookmarked for future reference too..Thanks for this video.
Thanks!
Literally the best tutorial, very nicely structured and super informative
Hy! watching this before 1 hour submission of my data tableau assignment and gotta say you are saving lives out here! this video covered all the basics one needs to start right awayy! Love you man! Thank you soo much!! i wish u wld teach all the subjects in this world! you make it soo understandable! Thank youu!
Awesome and straight to the point. If everyone explained it like you did I could master this in no time.
You are so correct Jess Morris.
Two years later, this is still awesome!
Great tutorial. Exactly what I needed! Way easier to understand than other Tableau dashboard vids. 👍👍
One of the best videos on Tableau I have watched. Please make more Tableau videos
I had to follow this video for a class and I am very happy. This was a great video!
WOW I'm just shocked at how you made me look at Tableau in a different way. I used to hate it cos I did not understand it and I'm pursuing a Data analysis career. Thank you very much, I just subscribed hoping to see many great videos like this one.
Absolutely amazing demonstration that covered a lot of elements in such a short amount of time. You would make a damn good teacher!
It was really awesome !!! Felt so confident while creating this dashboard 😊 Thanks a lot ❤
Best Tableau training on UA-cam!! Thank you!
This was the easist and fasthest dashboard I have ever made, excellent explanation, thank you very much for it! It's been very helpful.
Very well explained. I have never used this before, but after watching your vid, I feel like I learned so much already. Thank you for taking the time to put this vid together. I look forward to seeing more.
You are awsome. The whole worth of month's course in 26 mins thank you
Unimaginative and Unique presentations that reflects a great attractions in continuing my Tableau training specifically donuts or butterfly charts.
Great one! It covers most of the features of tableau in short time. This is very helpful for me. Thanks a lot for this excellent tutorial.
Bro, started a new job using tableau, still up to speed like they want, your video was the best/well put together video I have come across so far, subbing for sure!
Would highly highly recommend learning LOD calcs, table calcs, order of operations (understand context filters), parameters and dashboard actions. You should then be all set. Congrats on that new job and good luck :D
@@stanley.george.joseph that's crazy, my co-worker just told me to learn this before he left the office today. Do you have any recommendations like videos, courses, ect that I can learn LOD? Thank you so much for the recommendation, I greatly appreciate it!
This was excellent! Very easy to follow along and also liked the tip to create a donut chart.
Excellent tutorial to add to my portfolio. I especially love the donut and butterfly examples. Thank you so much for this information!
Excellent Dashboard - Thank You!
Found that Butterfly Chart particularly cool, never knew that could be made in Tableau! :)
I enjoyed it all because you are very clear to understand. That is why I am subscribing to all your posts.
New Project (Done) = New Skills (Learnt)
ThankYou
Good job! Almost a recap of What I have learned from a long course.
I just found this video and I got so much value from it. Thank you
Great Job Stanley. Especially loved the breakdown of how to approach a dataset which is the starting point for any analysis. I had never thought of using a butterfly chart but will start using it now. All the best!!!
Explanation is very well,great job.
Simply superb ...there are many long videos that look complicated. Stanley thx for this amazing video.😊
Hey Stanley! This is awesome, you helped me create some great visualizations for my capstone project this semester
Great job champ, best tutorial i have seen regarding Tableau. Thank you
we need more people like you..... video too, such an excellent work..
agreed :)
Thank you this is a big help for me, i am learning tableau for data analysis and this will be my first foundation to learn more about tableau
Thank you so much for making this video. I was able to fulfill to-do-list for this month in less than 2 hours.
Nice, tutorial, simple, easy and elegant.
Thank you
Very well explained and very unique way. Felt like watching those premium tutorial videos .. good on you 👍🏼
Thank you so much! Very easy to follow along. You covered a lot in 30 minutes.
Thank you for this video!! Built my first dashboard watching you
You are absolutely perfect for teaching Tableau. I love and enjoy this tutorial!
Dude, this is wonderful ! Thank you for doing this. I have learned a great deal.
This is great! Love the way you explain everything! I needed a refresher and this video was perfect!! Thank you 🙏🏻
Nice work buddy... Great to see you at the end of the video... Thanks for posting the valuable content :)
Thanks a lot.This is my first Tableau Project. I really enjoyed the way you presented it..
Amazing tutorial! Learned so much in this short video. Thanks!
LOVE LOVE LOVE this video! THANK YOU for sharing!
It's useful, simple and can be recommended. Thank you !!!!!!!!
I followed every part of this tutorial. Thanks. Was really insightful
Amazing and easy to understand. I learnt new things in this tutorial.
No time wastage. Every minute worth it.
You have won my subscription Brother. I will be waiting for more videos from your channel. Thanks and God bless
Thank you so much Stan, This video is insightful. I dully appreciate this and look forward to getting more from you.
Great Work! I feel confident after this thorough presentation!
I love how you made donut chart n butterfly chart....creative you are..!!
this is really helpful and super clear for me. thank you so much for creating this!
So helpful, Stanley, thanks for your time and generosity!!
my man keep these videos coming. they're really helpful.
you just made my day! Amazing presentation - concise, resourceful, comprehensive AND friendly! two thumbs up! and i'm so following you!
Hi Stanley,
I made this. The tutorial is very helpful.
Thank you.
Bravo! This tutorial is very amazing. Thanks for making me have a great beginning in learning Tableau.
The best video I've seen so far, thanks a lot
Amazing work and description, in a very concise manner. Just amazing. Thank you 😊
Please post more. This is really good.
Good work Stanley, keep doing.
i really like the explanation. i was able to learn a lot of things from this lecture and it was as detailed
Absolutely awesome work. Thank You man. We are waiting for next video. You are genius .
Very good presentation ...
Hi Really amazing tutorial specially Donut and Butterfly Chart, Please make more case study. Thanks for sharing valuable information
Amazing job ! thank you for this nice and to the point implementation!
Damn man you're already better than I am at using Tableau haha, the donut bit was very creative imo
Thank you so much. Literally saved me in my college project !!
Thanks for making this amazing dashboard project It really helped a lot !!
Exacly what I needed, thank you so much!!
You have done an amazing job explaining
This was helpful to me, thanks for creating this video
Thank you very much. Nice,insightful and very easy to demonstrate.
Amazing tutorial. Please make more videos on tableau with different datasets.
Just wow. Great explanation and it was very easy to understand. Thank you 😊.
This is awesome. I followed through and I reproduced the dashboard. Thanks
This was amazing i loved it thank you so much please make more of these!
excellent tutorial, thanks Stanley.
This is amazing your teaching is well explained thank you
Que excelente tutorial hermano, conciso, directo y muy completo, felicitaaciones y muchas gracias
Great, learnt a lot of things about Tableau, good practice.
Great tutorial. Thank you for your posting.
Its Fantastic... Keep uploading more projects on Tableau.
Great work, exactly what I wanted 🎉
Great tutorial as a beginner I found this very helpful
Excellent, Joseph. Thanks.
Agreed! Great tutorial for beginners like me.
GREAT VIDEO. keep it up!!! I highly recommend this one!
Thanks from South Korea!
super impressed with your video and presentation. thank you!
Thanks mush, very good content. Given me a nice insight. Wonderful Work.
Hey Stanley, Thank you so much. This is really awesome and useful.
Wow amazing video Stanley👌
and there it is !! an amazing tutorial 🙂