Conditional Formatting in Multiple batteries Graph in Excel

Вставка
- Опубліковано 26 сер 2024
- Hello Friends,
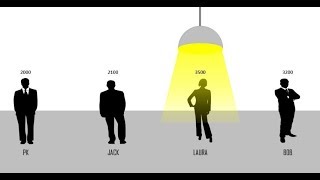
In this video you will learn how to create a multiple batteries beautiful 3D chart along with conditional formatting.
Please download the excel file from below given link:
www.pk-anexcel...
Website:
www.PK-AnExcel...
Facebook:
/ pkan-excel-expert-9748...
Pinterest:
/ pkanexcelexpert
Telegram:
t.me/joinchat/...
Twitter:
/ priyendra_kumar
Send me your queries on telegram:
@PKanExcelExpert


Simply without words, very good innovation, greetings from Bogotá Colombia. The language is not an obstacle, very grateful.
Thanks for watching and sharing your valuable feedback
Your videos are fantastic. Thank you so much for taking the time to make them. They are a huge help.
Thanks for your valuable feedback
Awesome, Flawless and maximum... Love to watch your creativity and innovation that how you did and manoeuvre
Thanks for your valuable feedback
Nice sir., conditional format 🙏🙏
Thanks for your valuable feedback
Mr. PK, you are indeed an Excel Expert. You made my day anytime always... You are a great teacher bro.
Thanks for your valuable feedback.
Hello sir, i am Mathiyalagan from Sri Lanka. very useful your sessions. thank you so much
Thanks Mathiyalagan,
For watching the video and sharing your valuable feedback.
Please share this with your friends and colleagues whoever is looking for excel and vba tutorials.
Thanks for your support to my channel.
Hello I'm watching your videos and I need to say that all of them are amazing, thks a lot.
Very nice video, I like it very much.
This is very helpful for making nice dashboards.
I created this chart for work, its amazing. How could I format to use yellow as well for when half the target is met??
Thank you ! From Vietnam
Thanks for watching
Thank You For Your Easy Way .....................
Thanks for your valuable feedback
Hi PK, Can we do this in Power BI also? If yes, could you please share the video, Thank you so much. You explain step by step, it is easy to follow up.
Dear PK, really I learnt a lot from your videos as a great help to mankind. Further I want to know if we can use three colors, red, amber and green for ranges below 70%, between 70% to 85% and above 85% respectively. If yes then how because I used the formula but got error. Thanks
Thanks for your valuable feedback. Yes we can use 3 colors also. I will definitely try to make such video very soon.
Please pk upload the video for three colors or write in the comment box the procedure so that I could complete my required graph. I tried so many formulas but they are not 100% fitted.
Thanks you dear. Included in my KPI report after a little amendment
Thanks for watching and sharing your valuable feedback
Very very cool!!
Thanks for your valuable feedback
I love this! I followed your video and was able to create exactly what I was looking for. I do have a question, however. I have TWO "batteries" that exceed 100%, and have "grown" taller than the other batteries. Is there any way to lock the battery size, regardless of percentage?
hi sir. you are doing an awesome job. Also could you suggest how to make it for 10 % as total rather than 100 %. plz reply
Awesome..
Thanks for your valuable feedback
Excellent tool ! and I am using in my dash board . Is it possible to add values in the data label along with the %? Pls help me to have both in the chart. Thanks in advance.
Awesome!! Sir
Thanks for your valuable feedback
Could you please help how to create this chart using slicers. Many Thanks for your valuable knowledge. Very impressive.
very nice bro
Amazing 🤟🤟🤟
Thanks for your valuable feedback
Excelent.......very very good
Thanks for watching and sharing your valuable feedback
Very good... thanks
Is it possible to keep the solid red but show a transparent green based on a forecast?
Wow, Great Bhai
Thanks for the watching and sharing your valuable feedback
Amazing video!! !:)
Thanks for watching and sharing your valuable feedback
Very Nice Video,, I have question here, if my attainment goes above 100%, how do I eliminate the transparent green and the entire bar looks only as solid green, Pls help
Hi Rajesh,
Thanks for your valuable feedback. Usually this chart is for 0 to 100%. If you are aware the maximum limit of your Metric then you can use it.
Dear pk, since two months I have been waiting for your video which I have requested, three colors graph. Kindly expedite it for that I shall be very thankful to you.
Hello Friend. How come on the spanish 365 office version the NA() formula is not working? Other than that, everything is up and running. Could you please help me out?
EXCELENTE VIDEO
Thanks for the watching and sharing your valuable feedback
very very good
Thanks for watching and sharing your valuable feedback
Hi PK.. if SL% is 0%.. value( 0% )it is not showing in bar graph.
In conditional 3d graph how we can link 10 executive 12 months performance by single graph. Pls share
Bhai please prepare a chart on invoicing
will try to create
Brother, Please help me with macro recording, I am eagerly waiting for that.
How to use in 2013 excel
#Pk: an excel expert how to use this in excel 2007
Dislike. Music in the background is really distracting. Unnecessary and inappropriate. Really stupid idea.
very very good
Thanks for watching and sharing your valuable feedback