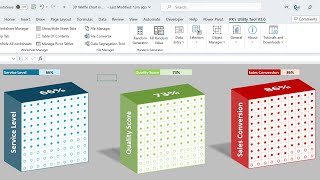
An Effective Stacked Column Chart with Integrated Totals

Вставка
- Опубліковано 12 вер 2024
- #ExcelCharts #DataVisualization #StackedColumnChart
Unlock the potential of Excel with our comprehensive tutorial on how to create an effective Stacked Column Chart with Integrated Totals. Master this powerful tool for data visualization and elevate your analysis to the next level. Whether you're a beginner or seasoned user, our step-by-step guide will walk you through the process, making it easy to understand and apply. Dive into this tutorial to gain insights from your data, make informed decisions, and stand out in your professional field. Don't forget to like, share, and subscribe for more Excel tips and tricks.
Download the practice file from below link:
www.pk-anexcel...
Use of Symbols and Emojis in Excel Drop-down List and Excel Charts
• Use of Symbols and Emo...
Learn Step by Step Pivot table:
www.pk-anexcel...
Download the Free Project Management Dashboard
www.pk-anexcel...
See our Power BI Dashboard videos:
• Power BI Tutorial
Learn and download our interactive Excel dashboards free of cost-
• Excel Dashboards
Download the Calendar Control in VBA from below link
www.pk-anexcel...
Download our free Excel utility Tool and improve your productivity:
www.pk-anexcel...
See our Excel Products:
www.pk-anexcel...
Visit to learn more:
Chart and Visualizations: www.pk-anexcel...
VBA Course: www.pk-anexcel...
Download useful Templates: www.pk-anexcel...
Dashboards: www.pk-anexcel...
Watch the best info-graphics and dynamic charts from below link:
• Dynamic Graphs
Learn and free download best excel Dashboard template:
• Excel Dashboards
Learn Step by Step VBA:
• VBA Tutorial
Website:
WWW.PK-AnExcel...
Facebook:
/ pkanexcelexpert
Telegram:
t.me/joinchat/...
Pinterest:
/ pkanexcelexpert
LinkedIn:
/ pk-anexcelexpert
Twitter:
/ priyendra_kumar
Instagram:
/ pkanexcelexpert
Visit our Amazon Store
www.amazon.in/...


عالی دمت گرم
Thanks🙏
Thank you sir
Most welcome🙏
Superb 👍
Thanks a lot🙏
Awesome..... I like it...
Thanks a lot.
Hi do we hv this option in power bi... Pls suggest it will be helpful
Is it dynamic also
I mean if we change the base data will chart update on its own
Or can we link this to pivot table or chart
Yes, we can. I will create it in another video
ua-cam.com/video/arM2i0-6E8c/v-deo.html
Sir ji yeh panel chart kaise banate hai hindi main vidoe banayi na please