Finding a Histogram on a Graphing Calculator

Вставка
- Опубліковано 14 лип 2024
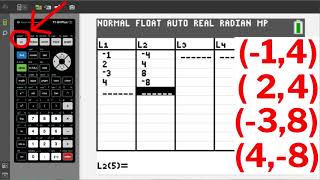
- Using the TI 84 or 83, it is possible to get a decent histogram of a set of data. Here we go through each step including how to read the histogram that results. You can see more info on these steps here: www.mathbootcamps.com/histogra...


Awesome! My statistics professor never demonstrated to the class on how to create a histogram on a scientific calculator. When it came to the midterm, I was lost. Thank you for posting this video. It was very helpful.
Whoever you are i genuinely love you for this, stats is stressful and a lot of stat teachers are lazy when it comes to teaching. both of the ones I have had are like here you go watch this video and figure it out, the one i have rn literally gave me an F on last test because my laptop glitched and it went from 1hr 10minutes left to 6 minutes. I was obviously angry.
Thank you!
Thank you so much for this !!!
Thanks.. it really helped me
Great to hear !
You sound like Kurt from glee.😳