You've Been Reading Volume WRONG (Mind Blowing Video)

Вставка
- Опубліковано 27 вер 2024
- Discord & Socials: beacons.ai/car...
GET MY BOOK: www.amazon.com...
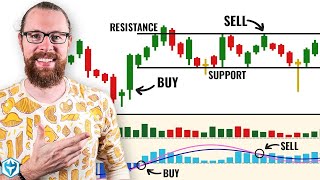
In this Stock Market video I will be discussing how to read volume correctly
If you have any suggestions for future videos such as Day Trading, Investing, Stock Market, Option Trading, Real Estate, Robinhood, TD
, ThinkorSwim, Crypto & Bitcoin, Entrepreneurship, Forex, or fun daily vlogs, please let me know!
Keywords: thinkorswim, options, options trading, td ameritrade, trading, stock trading, options, Fibonacci levels, support & resistance, technical analysis, live trading, trade recap, stock market, education
#OptionsTrading #daytrading #learntotrade
TTM SQUEEZE LINK: www.simplertra...
Ultimate Supply & Demand Trading Guide (Draw and Trade Zones): • Ultimate Supply & Dema...
Forget Level 2, USE THIS INSTEAD (Bookmap Tutorial): • Forget Level 2, USE TH...
Restarting My Trading Career: • Video


A little tip here. If you're looking at let's say 15-minute candles and trying to tag the volume, you can look at 3-minute chart to actually see in more details when buying came in and when selling came in. Then what your explaining here will start making a lot of sense right away!
means nothing unless U know what is happening within the BAR IT'S SELF . what is the vol for BUY to Open only . or sell to Open vol . can U answer this . ???
It is mean to pump the price and dump the price?
SIR the CHART'S i use for time is 1min,15min,30mni,1hr,day,week . also i will let U in on one study is my FOUNDATION of every trade i make VolumeAccumulatons but the Volume is for BUY to Open ,SELL Close ,SELL to Open , Buy to Close . using this U can see what's going on WITHIN the CANDLE
@@edwardsciacca8012 Wow..that's great man..Thank you for your advise. Hat off for you. I really understand what do you means. I hope can learn more from you
6:40 starts with real charts not drawings
You the man 💪🏼
thx bro xD
That was litt bro.. I definitely was reading volume as just red(selling ) or green ( buying) … once yu piece together the other info VOLUME is just how many ppl are in that candle … make way more sense now
I like that generalization a lot; that is volume being just the how many people in a candle.
Yeah the green and red volume bars makes it confusing. Should be change it to the same color.
to not get so dizzy with that indicator, learn to use better the Delta on volume, which tells you specifically, how the volume started to enter and how it ended, it is better than watching the classic volume, and in addition, sometimes the candle in the price ends in green, but in the delta ends in red, it is known as delta divergence and possible reversal, depending on the temporality you are using.
Is there a good delta indicator on TV?
Nope, not true. A buy limit order has NEGATIVE delta and a sell limit order has POSITIVE delta. A buy market order has POSITIVE delta and a sell market order has NEGATIVE delta. If you are familiar with footprint/volumetric (Ninja trader) bars, you will very often see extreme negative delta close to the BOTTOM of a move. These are limit buy orders entering the market. Alternatively, extremely positive delta near TOPS, limit sell orders entering. This is easier to visualize in Bookmap. If you are interested, I could make a video explaining.
As for volume, bar volume profile is probably the easiest way for new traders. Alternatively just remember that volume peaks around bottoms and tops (limit orders). Breakouts happen when aggressive (market orders) buyers/sellers push out of liquidity zone (consolidation) in search of new price zone (liquidity higher or lower). Important to note - this leaves a lot of unfilled orders thus most breakouts/breakdowns revisit the initial place to fill the resting orders.
These volume bars are time dependent and are specific to that candle (be it 1 min , 5 min or 4H or whatever). Better to look at volume dependent on price
Sure boss..could you do a video pertaining that matter. I am keen to learn it. Thank you boss
Volume Spread Analysis a level above SMC ICT in probabilities, it has 2 dimensional variables - price and volume that confirmed each others at pullback or breakout.
VPA analysis has been my go to since the 90s 😂😂,
i ask U break Down Volume what is VOLUME . What is Happening ( within each Bar ) if U can answer this question then U know .
High volume with a green candle with any wick is not a good time to short. Don't you think someone has already figured this out. I would wait for a better set up.
I’ve been reading the volume indicator wrong this whole time 🤯 Thank you so much for this! God bless you 😊
Great Video Brandon Simple and easy to understand traders should definitely consider volume more at key areas it makes a huge difference
🔥🔥🔥
No volume is a waste of time
Brandon how do you find your levels? Any videos on this topic. Also, is it ok to use the RSI overbought and oversold areas as well at key levels? Thank you for all you do.
10:38 actually it's easier than what you explained. The reason the trade was no valid was because the next green candle did not engulf the previous red. For me it would have been played out differently. The bearish hammer at the top followed by the bearish engulfing is where I would have gotten in. I trade similar to this but with different rules.
Or we can say that price comes to area of interest ( resistance ) and buyers tried to move the market up but then slowly sellers *absorbed* those buying orders?
Brandon, this video is fire!! thank you. yes would Love to see more video on volume.💯
🔥🙏🔥
Which site u use to scan high volume stocks?
Do you have beginner videos? These are difficult for me to follow. How do you find support levels?
Tons of them! Plus inside both of my books
Hi Brandon,
Great stuff..Much appreciated! But a quick question. Why does Volume bar closes in green if there are more shorters in that price?
Top shelf! One of the best explanations I've seen thus far on volume and it's importance based on location and price action.
❤️❤️
The point is that you want to be the type of trader that can literally set a stop loss and a gain and be done ….
If the majority of the volume is negative or selling volume, how could the candle still be green?
Yes. Thank you. That does indeed need to be clarified. Selling volume and buying volume are always equal.
If the price close above/below of the previous candle it shows red/green it doesnt matter on the candle size
Well that’s more price action interpretation than volume.
Adding a lower time frame chart will allow you to rely on assumptions less often.
Excellent video. thank you..
great explanation, the missing piece in my system
How do you know if increased volume is on the wick???
If your in at the 50% retracement based off that first candle and u are trading 0 dTe contracts .70$+ risk isn’t realistic
I do this everyday brother. Come watch me trade live :)
VOLUME what are U talking about are U looking at volume to open , to close , sell to Open or sell to Close . first of all brokers are not the same and don't have access to ( ALL ) volume data and U have 1min 30 min 1hr 1day weekly . use VolumeAccumulations tell's U more and it is live DATA .
Tell's ??? 😂😂😂
Go learn VSA then delete your comment 😮
@ewg6200 makes zero sense, ignoramus.
Doesn't matter if the volume is different from broker to broker as long as volume spread analysis is consistent.
I see this guy on every volume video complaining. My question is, if you know better than every person explaining this stuff, then why are you even watching it. Get a job
Great video. Thanks!
🙏🙏🙏
03:25 you're WRONG. A single pull back at a resistance level is not enough reason conclude its a trend reversal. By the way you need up to like 2 more bearish candles validated by volume to conclude its a reversal. Even such a V-top reversal is uncommon. Most times price consolidate a little while before a trend reversal.
I do this everyday. Join the livestreams I do & see it in action
@@BrandonTrades i hear you
Both of you are correct...because it is about probability% and risk2reward ratio....Brandon will have low probability but higher reward...you will have higher probability but delayed entry.
Dead chart volume date is fruitful as leading indicator? I don't think so , might be lagging
Wouldnt it be 'clearer' if you zoom in to 1min candles for the rejection volume incoming and than zoom out to a 5 or 15 min tf
This is the common way of analyzing volume. What's the other "wrong" way?
Thank you!
I definitely found value, thanks Brandon I appreciate it.
Glad it was helpful!
Great video as always Brandon. Best teacher in the game
you know we always there on them morning lives
what an awesome video, thank you!!
Awesome.. Great explanation ....
Glad you liked it!
This called ending volume. Great vid
Hey bro, you’re doing a good job but please could you remove your face from the video to increase the screen real estate. You handsome face on the DP is enough.
Great content man ty
really good, thanks
Welcome 📈
Thanku very helpfull
Baw-lee-oom
Vaw lume
Volume or money
Interesting video.
📈📈
Elite
🔥🔥🔥🔥
💯💯💯
There is absolutely NO SUCH THING as "buying or selling" volume.
It's just volume. As each trade needs an opposite side to count as volume.
This is utter garbage.
‼️‼️‼️‼️
👏🏿👏🏿👏🏿
you are not a good teacher
🍪
Every candle that we see is just an average of the total transaction made in the unit of time. So lets say 100 transactions took place in 1 minute. 70 transactions buyers, 30 transactions sellers. Algo turns the candle automatically to green, because majority of the transactions came from the buyers. So final result is green, that we see on the chart. But we gotta know that there are sellers too, and even this ratio can change dramatically in the next 3 candles, buyers vs. sellers will be 70-30, then 50-50, then 20-80, and only last candle can be red, the price action must be understood like a complex fight between buyers and sellers in that unit of time. There is no way that sellers are gonna stay and watch and let 100% buyers do their job, is just that they are not willing to enter trades or they have not enough power to overcome the sellers untill a given moment (price level approaches to an important level). This is how a candle stick looks like from the "inner side", like a fight whichi implies both enemies.
best comment
Thanks for this video. At the 6:20-6:30 min I saw many examples during earnings this week after a stock dumped. Since I am new and still learning I missed opportunities for long positions. Good stuff.
Most important chart in trading is orderflow chart but it is not available for free, once u have that it clearly shows the buyer and seller orders in that time frame along side candle, if one is bigger then other then in later candles market starts falling or rising, yup it's very simple that's why it is not free.
Great video, I wish they could make the volume indicator different as it’s definitely tricky to figure that out when having to compare with price action. This will definitely take sometime getting used to.
It exists it is called market footprint😊
I am already implementing this kind of strategy in my trading. This is less stress and more accurate in HTF. PA + volume + candle closes = clarity.
Best way I can think of to "interpret where volume is more buy/sell" would be to drill down to a lower timeframe chart and compare the volumes relating to our "levels of interest". Makes simple sense to me ... No matter how you look at price action (timeframe, volume, ticks etc), there is always a story within the story
I really enjoyed this video! Yes, I’m definitely interested in more videos from you. If I understood correctly, you Live stream here on UA-cam every morning?
Thanks so much that really confusing for me but now I will pay more attention
What Are you talking about?
Useful content
The video was clearly great and helpful brother..,,no need to add the "mind blowing video" in the title. I hope you dont see this as a negative comment.
Correct. The color of the candle represents the volume delta and it's not all sell or buy volume.
💯
🔥
What time frame would this be on?
Many different time frames will show different signals. As a trader you need to choose a timeframe that fits best for your style
at around 3 minutes you said you can assume a majority of the volume on the third candle stick came in on the sell side. I get what you mean but for a true understanding of what's happening, that would be wrong. There is equal selling and buying at that resistance level but the sellers were more aggressive with their selling. They were in a hurry to dump and agreed to lower and lower prices , Thus giving the top wick on the candle.
the Problem U get what get . but there is other Volume Data break it apart and Chart it individually
when U answer what is VOLUME then maybe U understand . an so far U have not trading from 1967 come on teach me if U can .
Volume comparison required
Thank you, very informative 🎉
you always help me out with every video
Wow! Thank you for this Brandon. This video alone earns my sub. Thanks again. Happy New Year and God bless!
📈📈📈
Great video Brandon. Thank you!
That was really clear! Thank you!
🙏🙏🙏🙏
@@BrandonTrades do you have one on understanding the fibs better?
@@barbariancauldron3284 tons on my channel and my books!
@@BrandonTrades thanks!
🐐🐐
this video is a gem, thank you
📈📈📈📈
make way more sense now
🔥🔥🔥🔥
Thanks mate
🔥🔥🔥🔥
God save anyone who needed this video and is trading with live capital
?
Greatly appreciate this my friend.
Would be nice if you demo this on a chart, to see it actually working, replay etc as opposed just theory.
Examples of where this has won big for you maybe?