How to create a Gantt chart in Power BI (with a free visual!)

Вставка
- Опубліковано 5 лип 2024
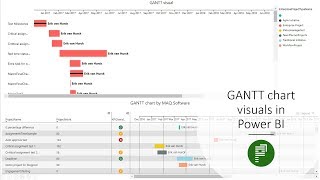
- Gantt charts are typically used to track project progress, but they can be useful for any data that has a start and end date. In this video, we go over how to configure one in Power BI using Microsoft's free custom visual from AppSource, adding bookmark filters to make it more user-friendly.
Looking for something more elaborate with milestones and dependencies? Try this video:
• How to use David Bacci...
Need to get Planner data? Here's how:
• Get PLANNER Data into ...
Or, how to get Planner data for ALL your groups and plans:
• Get Planner Data for A...
0:00 Intro
0:20 Installing the visual
0:58 Power Query - get relative days from today
4:19 Configuring the visual
10:20 Creating bookmarked views - Наука та технологія


Thanks Christine for your explainations of how to create Gantt chart using this additional visual. It was really helpful
Sure, glad it was helpful!
Thank you. Creating a Gantt chart from scratch is a lot work. This saved me
Great! Thanks Christine. You have answer for most of my question in MS Gantt Chart.
Exactly what I needed, nothing more, nothing less. Thank you.
Thanks Christine. Got exactly what I wanted. Very helpful.
Excellent! Thank you!
Awesome, thank you!
Thank you! Excellent view!
Thank you Cristine - this is awesome :)
Really helpful thank you! Successfully got my chart off the ground!
Awesome!
Hi Christine, really useful video. Two issues I’m having with this Gantt chart
1) how do you display milestones?
2) Can you change the sort order to be earliest start date first?
Thanks you. It's really helpful.
Very noce! Thank you!
Great video! Can this be used to visualise more than two levels? Epics, Features, User stories and tasks for example? Thank you.
No, but it looks like the xViz custom visual may allow that with their task hierarchy? ua-cam.com/video/wkVwzwmoCas/v-deo.html
Great video, really helpful. Quick question how to have day, weekly, monthly, quarterly option available on the top of the gantt chart (explained at 05:05) ? so that user can change it as per his/her requirement and doesnt have to go to format data type and change to monthly/weekly etc. Any assistance welcome...thanks in advance
Yes, you could do this with bookmarks. I have a video doing something similar, but for a different visual setting. You essentially create a visual and bookmark for each setting configuration (weekly, quarterly/etc), then use the bookmarks to show/hide the related visual. Here’s the tutorial: ua-cam.com/video/e5yWWYboPaU/v-deo.htmlsi=XPU2Xkh-NlxgFps2
Excellent explanation Christine. One question, How can you combine two sets of "data" in one Gantt chart. Continuing your example of contracts if you had a separate table with information about prospective clients in which you have a similar "columns" but the activity is looking for new clients?. That way for example you could visualize the status of the current contracts and the time for the new contracts to be signed. Thank you very much for your help.
You can append two data tables in Power Query as long as the column names are exactly the same in Power Query. Add a custom column to both that labels each table before appending (the formula is just =“some label here”) if you want to differentiate them in the report. If I remember, the category coloring for the MS Gantt visual seemed to not be functional when I tried it out… it’s possible that it was just me though so you should give it a try! I’m not at a computer right now but will look at again tomorrow. The visuals program manager at Microsoft said the Gantt is on the list for overhauling eventually but it will be a while (they collect feedback on #PBICoreVisuals on LinkedIn).
I appended my data tables and it worked.
Now I want to find a way to group sub-tasks under tasks. @@bi-ome
Great content! I am trying to add milestones to my Gantt chart and the moment I do, the bars indicating my schedule for each phase disappear and I only get the small symbol for the milestone. Do you know how I can see both? Would love to have the bars indicating the overall schedule and then milestone symbols overlaid. Thanks in advance!
I had no luck getting the milestones or the color categorization working - I am not sure they DO work. If you need extra functionality, there’s a Deneb template by David Bacci that’s open source, or there are other paid Gantt visuals-
Hi Christine... great video. Please a quick question. Is there a way to display the view that is rolled up to the bucket level. For instance, I want the chart for Amazon to show one bar with a starting date of April 2022 and end date of Jul 2023, which is actually the combined bar for Amazon but can still have the individual bars alongside
It will show that way if you collapse the grouping... so I guess you could collapse them by default and let people open them to see details? There's not a setting that will toggle the group bar while it's expanded that I see.
Hi - Thank you. How can I create a custom column to calculate the end date from a fixed date?
You can add days (or months or years etc) to any date, it doesn't have to be an existing date column. The trick is inputting your date in the way PQ expects it - there is an example here: learn.microsoft.com/en-us/powerquery-m/date-adddays
Potential silly question, but I’d like to modify the data type for the x-axis depending on the bookmark. I.e., for the expiring soon data, I’d like the axis to be monthly, and for the long term, I’d like it to be quaterly. I know the option to change the data type is in the visual options, but it doesn’t seem to stick with the right bookmark.. when I change it to quarters for long term, it also changes it for short term view
The way to do this is to essentially create two visuals (or however many different settings combinations you want) configure one for each of those settings combinations, then show/hide them with the bookmarks using the visual visibility setting in the bookmark. The bookmarks only control data filters, page selection, or visual visibility, not settings, that's why we have to go that route. I did a video here where we swap visuals with bookmarks, so if you combine the techniques from both it should work the way you want! ua-cam.com/video/UNTtCPs8pQA/v-deo.html
@@bi-ome great! Thanks so much again, I think this will also help me put two different flow charts within the same page, and having buttons to toggle between them. Thank you so much!!
Hey, Great video. Thanks Christine. I have one question, Instead of 1 hour of interval time, i need half hour (30 minutes) interval time on x axis. Is there any way achieve it? Please reply
I don’t think you can modify the functionality of this visual in that way, you’d have to use a different visual. This one is very limited; I only chose it for a demo because it’s Microsoft’s and widely accessible
@@bi-ome ok thanks
Great video~Can put the some text on the bar for each record?
This visual is very basic - there have been hints that something better will be released eventually, but if you want customization you have to go with Deneb or custom visuals currently :/
Can i change the shape of the bars? meaning that they won't be with rounded corners?
Not this particular visual, I think Bas’ channel has one that simulates a Gantt using a table visual that would be square-corned though (channel is called How to Power BI).
I have a Data Segment (Year) on my page. How can i ignore that "Year" filter when saving a bookmark? I mean, when i click my "expired" button it will always set the year to the one i had when bookmarked.
It depends on where you have the filter set. You can configure the bookmark to update "only selected visuals" in its settings and only select your Gantt when you update the bookmark - that will let you ignore anything in that slicer. I would recommend using a slicer over the filter pane in this case
@@bi-omeIt Worked! Thanks!!
Is there a way to do it based on hours instead of month/days.
Not with this visual, but other visuals have more configuration options.
I have a question. Let's say we have three tasks A, B and C. Their Start and End dates are following:
Task A: Start Date is 2 Nov and End Date 3 Nov.
Task B: Start Date is 2 Nov and End date is also 2 Nov.
Task C: Start Date is 2 Nov and End Date is 3 Nov.
But in the Gantt chart view it shows the sames filled line from 2nd to 3rd Nov. Why it is so? As we have for Task B same Start and End date. What modifications needs to be done?
My guess is that it’s getting confused on items where the duration comes out to be 0 days… it still wants to show a bar, so it gives it the only length increment it can, which is whole numbers. It’s not designed to show tasks that have no duration. You could try showing those as milestones instead, which I think use their own date column (with just a single date), and blank-out the start and end on it? It is very much a bare bones visual, hoping they improve it. Microsoft just hired David Bacci on their visuals team (who made an awesome Deneb Gantt I did a video on), so I’m hopeful that he does an improved version eventually!
@bi-ome thank you very much.
how to make that chart responsive ? (in Format this option is inactive :| )
Depends what you mean by responsive - that toggle is usually for things like collapsing axis on small visuals and entirely changing how it displays when smaller. Everything in PBI should scale up and down with screen size as long as you have the view for the page set to "fit to width" or "fit to screen". You can't change how this particular visual behaves, but it should do the latter--
I need your help in this gantt chart for ( problem in the milestones )
I found the milestones to be really lackluster in this visual, but if you post details I can try to help-
I would also like help on Milestones. Using your information, Fro example, how could you add a milestone for example End of Fiscal Year where you could use a specific date and maybe the description "EOFY". Would you need to set an additional column "milestone" or something like that? @@bi-ome . Thank you.
If you have milestones or other more complex task data to visualize, I would recommend this Gantt instead: ua-cam.com/video/tOhAxulPAoc/v-deo.htmlsi=O4oLKnCT9mXFyGqa
The milestone visualization in the MS visual seems broken to me (it could really use some updates...)
My get more visual is not working, it is asking me to log in with my email which it will later decline me
Pls I need help
If you are having trouble getting to the app store, you can also download the file with the "get it now" button here, and import it from a file instead of from appsource: appsource.microsoft.com/en-us/product/power-bi-visuals/wa104380765?tab=overview
Hi Christine, really useful video. Two issues I’m having with this Gantt chart
1) how do you display milestones?
2) Can you change the sort order to be earliest start date first?