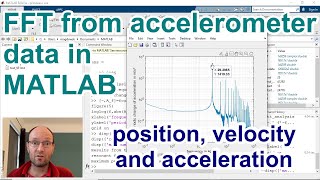
FFT transform of experiment data

Вставка
- Опубліковано 13 лют 2021
- #FFT transform #time-domian #frequency-domain
This video introduces the FFT transformation of the experimental data by the oscilloscope from the ultrasound transducer.
It is very helpful if you want to get your time-domain data into the frequency domain to check the working frequency of your sensor.
#FFT transform #time-domian #frequency-domain


Very helpful! THANK YOU!
Thanks a lot ma'am for your video. It helped me tremendously in my project.
THANK YOU SO MUCH U HELP ME DONE MY FYP FOR DEGREEE!!!!
experiments are very helpful.. first I want to ask do you have a tutorial on analyzing tidal data using the fft method in matlab? can i ask..thank you 🙏
Thanks you !!!!!!
Thank you
how did you define the x axis in FFT domain?....what is the logic behind defining the f from -M/2 to M/2?
thanks
For example, if I have a set data from a vibration sensor (velocity of vibration), but those data values are only from every hour, can they be used with FFT?
Good video
Thanks a lot.
Hi mam. Kindly explain the unit of y axis in the FFT output figure.
for the fft graph, y-axis represent DFT value?
I am getting " unrecognized function or variable 't' " in command window.
Please tell what to do
I want to ask about your sample rate. How do you get that number? Is that the time/div that you set on the oscilloscope?
Thanks a lot for your question. I set the sample rate on the oscilloscope.
So its the range of time from one sample to the other sample, am I right?
Thank you
I have one question
From this example if i want to know the amplitude at 500 hz after plotting fft , what is the command?
Did you find the answer to this question? or any other video that helped in that?
How do inject maximum amplitude at 0 Hz?
can anyone explain how to get the value of dt?
I have a MAT.file, so should I use a different code for the software to read the data for my mat file ? Like that of csvread?
Yes,you could use the csvread function
i have same issue
hey , i am dealing with the situation in which i am provided with voltage data set including the nan values i need to find fft frequency m using similar method but the result is not desirable means i want a 50hz frequency but its coming at about 125 hz Can you kindly help me figure out that does sample rate effect this or just its a case of speeding up
You told at beginning time is first column. But in time domain plot you plotted, plot(1:2500, 2). Second column as time why?if I have not understood clearly please explain it to be briefly.
plot ((0.0001:0.000175:0.35),t(1:2000,2)); use like this the front is range for u x axis, the time, u can set whatever range time u want with any increment as long the is same with ur set of data
for line 16, may I know how that frequency equation is determined?
I want to know, too.
Did u find out?
how to find doppler shift from fft ??
How sample rate is taken is there any criteria?
I set the sample on the oscilloscope
hey,can i get that csv file
hi, can i get your csv file?
Why the y axis magnitude of time domain is different with frequency domain?
Thanks a lot for your questions. The magnitude in the time domain is the voltage magnitude at each moment. The magnitude in the frequency domain is the magnitude for each frequency. They are different.
I'd like to ask some questions regarding to coding which I've done for FFT analysis. May I know your email?
can we analyse the experimental data using this procedure? can you share your mail id please
Please tutor can i have your email address so that i can ask you a question related to how to choose the frequency length when plotting a graph? please
may I contact you through email, please?
Yes, cg1025609372@gmail.com
Very informative video. Can you check your email ? I need your support. Thanks a lot, sister