Tableau Dashboards in Hindi | How to create Interactive Tableau Dashboard | Great Learning

Вставка
- Опубліковано 15 жов 2024
- 🔥1000+ Free Courses With Free Certificates: www.mygreatlea...
🔥 Get the free certificate of completion for the Course, Register Now: glacad.me/3qvtJTJ
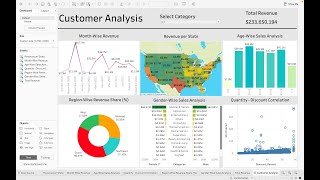
Great Learning brings you this live session on “Tableau Dashboards in Hindi”. Visualization of data is very important for a business project. Your clients or customers might not have the technical expertise to understand the end result of your project, and that’s where visualization of data plays a significant role. It becomes extremely essential to display the final information in the form of easy-to-read graphs and dashboards. For this very purpose, Tableau is the best in the market. With the help of Tableau, we can create stunning visualizations. In this particular session, we will understand the concepts of Tableau and install Tableau into our systems. Going ahead, we will learn how to load data into Tableau. After that, we will work with different types of charts such as bar plot, scatter plot, pie-chart and histograms. Finally, we will learn to create a beautiful and interactive dashboard in Tableau. There will also be a QnA session where all your doubts and queries will be answered.
Earn a prestigious Data Science certificate from MIT Professional Education. Enroll now and elevate your skills! www.mygreatlea...
Jumpstart your career in Data Science with our course designed for freshers. Apply now to learn more! www.mygreatlea...
🔥Check Our Free Courses with free certificate:
📌Tableau For Beginners in Hindi: www.mygreatlea...
📌Tableau Basics: All You Need To Know: www.mygreatlea...
📌Getting Started With Tableau: www.mygreatlea...
⚡ About Great Learning Academy:
Visit Great Learning Academy to get access to 1000+ free courses with free certificate on Data Science, Data Analytics, Digital Marketing, Artificial Intelligence, Big Data, Cloud, Management, Cybersecurity, Software Development, and many more. These are supplemented with free projects, assignments, datasets, quizzes. You can earn a certificate of completion at the end of the course for free.
⚡ About Great Learning:
With more than 5.4 Million+ learners in 170+ countries, Great Learning, a part of the BYJU'S group, is a leading global edtech company for professional and higher education offering industry-relevant programs in the blended, classroom, and purely online modes across technology, data and business domains. These programs are developed in collaboration with the top institutions like Stanford Executive Education, MIT Professional Education, The University of Texas at Austin, NUS, IIT Madras, IIT Bombay & more.
SOCIAL MEDIA LINKS:
🔹 For more interesting tutorials, don't forget to subscribe to our channel: glacad.me/YTsu...
🔹 For more updates on courses and tips follow us on:
✅ Telegram: t.me/GreatLear...
✅ Facebook: / greatlearningofficial
✅ LinkedIn: / verification
✅ Follow our Blog: glacad.me/GL_Blog


great......your teaching style is superb in short video
Great video sir. Thankyou ❤️
Thank you great learning to upload this video and sir your teaching is...............fabulous
thanks, sir for providing your time and knowledge in the Hindi language
Superb,👍 easy way of teaching and concept clearing wise.
Hi we are glad that you liked our Content Please do subscribe to our Channel for Similar & Awesome Content
As it's name @Great Learning suggests it is "GREAT LEARNING" with you🤗
Just an awesome video on tableau for beginners, I love learning from you sir, Thanks for providing such videos.
Hi we are glad that you liked our Content Please do subscribe to our Channel for Similar & Awesome Content
Thanku sir ❤
All is well.👍
Dimensions : these are quantitative values which shows all type of string data eg. categories ,segments
measure : these are quantitative values which shows numerical values eg. quantity, sales
Sir, what shud i do to learn tableau shud i refer videos and try doing by myself. or book would help.
nice video sir, very help full ...❤❤
Your voice 💖
Thank you for such a great lecture. Love from pk
informative video thank you sir
your teaching way is so easy to understand....thanks a lot.....
really thankyou so much sir.
Great learning Videos are excellent but Screen need to zoom at Particular poont
Hi, Thank you for your valuable suggestion, We will try to look into it and will try to bring the video on our channel
all is well...
Thankyou Sir
YOU ARE TEACHING IS VERY EXCELLENT SIR😊😊
Hi sir please provide job's as date analysis for freshers
Can you help me which Course i choose python ya SAP ABAP. As consideration of future opportunities.
Can you please bring tutorial of power bi with servicenow and creating Dashboard with the help of servicenow complete tutorial
nice lecture, thnx
Dimention will be in raw with name of indicator but measure means calculation in sum, count
Hi Sir, You doing awesome sessons . Can you tell me please, in which area I need to focus for Data Analyst
Like primary key is for ids like that of dimension works in tableau
How can I start my career as business analyst...i m mba+b.cs computers Hons but gap of 12 years. O exp
Thanks sir, Can I work on time factors in tableau. Can tableau be useful on merge cell of excel sheet
Sir tabkeau ka course kitne din ka hai aur iska certification kaise milega pls share answer sir.
Nicely described...
nice video thank you
Thank you. It's very nicely explained
awesome training on Tableau!! Thanks a lot!!
Hi we are glad that you liked our Content Please do subscribe to our Channel for Similar & Awesome Content
very helpful
Hi we are glad that you liked our Content Please do subscribe to our Channel for Similar & Awesome Content
Sir,
Workbook ya file ko description me daal dete so that we can practice 🙏
i am experienced civil engineer , please guide to enter in data analytics.
Hi, we would recommend you to follow this roadmap to enter data analytics.
To begin with start working on your excel skill and learn Advanced excel.
Next Learn and BI tool like Tableau or PowerBI.
Once you are comfortable with above tools learn the SQL (Begginer-Intermediate). This should suffice to build you profile in Data Analytics. Parallely Update your resume, Linkedin and search for references in Linkedin
Dimension independent variable
Measure dependent variable
sir how could i go with ur data do u have the excel sheet
Sir plzz make power BI video
superb lecture
Hi SIr.
Please bring AWS full course in Hindi for beginners.
Regards
Nice Tutorial Sir!!!
sir can we expect advance tableau course in hind
Yes coming voice properly
Thank, but I'm learn tableau calculation. kindly suggest me deeply.
really informative video, it helped a lot, and I understood all the concepts in a single video, thanks!
Very nice
Hi we are glad that you liked our Content Please do subscribe to our Channel for Similar & Awesome Content
Thank you
Hi we are glad that you liked our Content Please do subscribe to our Channel for Similar & Awesome Content
Nice video please share pratice file
HOW WE CAN DIFFERENCIATE BETWEEN PRIMARY DATA AND SECONDARY DATA. AND WE CAN RECOGNISE IT IN TABLEAU WORKSHEET
you are a great teacher, Superb and simple way of explaination and I have understood so easily because of you.
Thank You for creating this video.
23:32
i have 5 year's experience, but freshers in tableau
Yes I know
Can you share dataset
Great platform
Hi we are glad that you liked our Content Please do subscribe to our Channel for Similar & Awesome Content
Can you please advise how to save my worksheets and dashboards and stories on my laptop. All I see is save on Tableau Public all the time.
Sir kindly provide dataset do you used in this video.
Hi This is free dataset available freely on the google
There is no assessment in GL's website for this course
Hello, Can you please share the same data set?
I'm fresher
Y
Sir tableau me dashboard design kese karte h
Are bhai dataset ki link toh de dete description mai
Please make video of power BI
🙏 thanx sir,
I'm Fresher
Dimension string
💯👍
Sir data analyst sikna ka liya ka ka knowledge lagaga??
can i get excel sheet that you are using for demo
can you please upload data set
License kaha se ले
Sir,
How to export Dashboard and chart
PLEASE PROVIDE DATA SET FOR TRADERS STORE
hii sir, when you put product name at row/column part it shows some table i.e very large data ( I think so.)
if we want to visualize this type of big data then what we will do?
same thing goes on my mind too
Can we get source file or excel file so we can practice it also
Fresher
i little bit knowlege of tableau
Awes😉
ok sir
Hi we are glad that you liked our Content Please do subscribe to our Channel for Similar & Awesome Content
excel sheet bhjo
It was only timepass the main thing dashboard will not doing
Edz
Thanks so much sir
Sir,
How to export Dashboard and chart