Це відео не доступне.
Перепрошуємо.
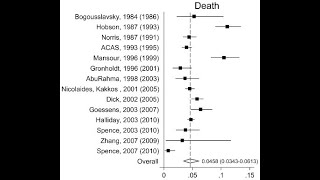
Interpreting a forest plot of a meta-analysis

Вставка
- Опубліковано 20 чер 2016
- This video explains how to interpret data presented in a forest plot. Described by David Slawson, MD, Professor, University of Virginia. From the Making Decisions Better: The Information Mastery Curriculum and Assessment Program, an evidence-based medicine teaching program from Clinical Information Sciences, ClinicalInformationSciences.com.


By far, this is the most clear interpretation of a forest plot I 've seen! Thanks alot for that!
Thank you for the kind words!
Best explanation I've come across. Have been stuck on my dissertation for ages and you've made it all make sense in less that 5 minutes. Thank you so much!
Thank you!!!! This is just the best. I have struggled understanding forest plots. This is clearly explained.
Thank you for being succinct! I finally understand this now without all the ambiguity of my lecturer.
Thank you so much! this helps a lot for my meta-analysis research requirement for my medical residency.
Very precise and clear explanation.
Excellent work . Keep it up.
The best and most succinct explanation I've seen.
Brilliant! I loved the wiggling objects as you explained their meaning :)
Succinctly presented. No frills. Love it!
Best explanation on UA-cam
thank you very much for the explanation.
Thanks a lot ! Very succinct and clear.
Thanks for the very complete video. I have a question: I am trying to find a JavaScript library that can produce forest plots and I am having a hell of a time. They are conspicuously absent in most libraries. Does anyone know of one that can be used? Thanks.
excellent presentation
It was very helpful thank you🙏🏼
Thanks for this
thank you!
Thank you sirs.
Thank you so much, brilliant. Can I kindly ask you - how the diagram appeared in your video? Is it possible to create a diagram on SPSS or only in Excel?
The diagram is a meta-view created by RevMan, a tool for meta-analysis. community.cochrane.org/tools/review-production-tools/revman-5/about
@@allenshaughnessy3715 THANK GOD I FOUND YOU! Thank you for the nformation
Very informative
Awesome 👌🏽
Thanks
Excellent
Thanks for the kind words!
Thank you very much sir
Crystal clear
nice explain
Wow!
It is the first time I do understand this
Hi Chris Kresser ...
Chris Kresser
VERY GOD AND LUCID PRESANTAION
My professor took 40 min to explain that
Lol. I feel like we all have the same professor😂😫
out of 200 people,,,150 were smoker and 50 non smoker.
among 150 ,120 get cancer,out of 50 only 5 get lung cancer,
if i input these data on rev man,,the box appears on right,,,,what does it mean?
Who’s here after the JRE Game Changers Debate?
If Chris only watch this video 2 hours could have been cut from the debate.
I'll be damned if I get caught in THAT trap in a debate.
Kyle Kisebach right?
Doesn’t study 4 cross 1? Meaning not significant. Also how do you account for overlapping Confidence intervals
The confidence intervals of several of the studies cross 1. Taken together, though, they show a significant difference.
Better call saul
James Wilks brought me here
Am I the only one that thinks this guy sounds exactly like Owen Wilson?