Creating Actual Vs. Target Charts in Excel

Вставка
- Опубліковано 9 лют 2025
- If you work involves reporting the actual and target data, you may find it useful to present the actual values versus the target values in a chart in Excel.
For example, you can show the actual sales values versus the target sales values, or the satisfaction rating achieved versus the target rating.
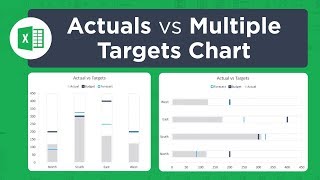
There can be multiple ways to create a chart in Excel that shows the data with Actual Value and the Target Value.
In this video, I will show you two methods to create Actual Vs. Target Charts in Excel.
The first method uses only columns bars to show the difference by changing the width of the target and actual values.
The second method uses markers to create a marker for the target value and the actual value is shown as the bar.
Read More and Download the example file: trumpexcel.com...
Actual Vs Target Chart in Excel
Achieved Vs Target Chart in Excel
Actual Vs Planned Chart in Excel
Actual Vs Forecasted Chart in Excel
Free Excel Course - trumpexcel.com...
Paid Online Training - trumpexcel.com...
Best Excel Books: trumpexcel.com...
⚙️ Gear I Recommend:
Camera - amzn.to/3bmHko7
Screen Recorder - techsmith.z6rjha.net/26D9Q
USB Mic - amzn.to/2uzhVHd
Wireless Mic: amzn.to/3blQ8uk
Lighting - amzn.to/2uxOxRv
Subscribe to get awesome Excel Tips every week: www.youtube.co...
Note: Some of these links here are affiliate links!
#Excel #ExcelTips #ExcelTutorial


Deleting that secondary axis is absolutely key to this working!!! Good job for putting that in the video.
Cool! I didn’t realize that if you delete the secondary axis both series will comply with the primary axis. Thanks for the trick!! 🔥
amazing! you get to the point quickly and explain everything clearly. thank you very much! 🙏
Many Thanks for this ! My boss loved it and i got an appreciation !
Sumit Bansal, I love how your videos are concise. Very informative. Thanks so much for Sharing your knowledge!
Excellent tutorial, nicely paced, concise and exactly what i was looking for, thanks.
Great video, it help a lot with a work presentation.
Great
Quite helpful. Thanks
Thank you brother
Very very useful! Thanks a lot :-)
Great one!!!
can you use this chart if your numbers are formated as numbers instead of "percent"?
very helpful...Thanks
Omg, i have been waiting for these awesome charts!!!! You rock....but change ur name 😀
thank you..
I am looking for actual and target for both revenue and profit in a single chart. May be 2 bars per month - one for revenue and one for profit. possible?
Please help to find this.
Is there any excel format or tool if we give estimated time in sheet1 it should display resource list from sheet2 who will finish in the estimated time. If 5 is given should display A will finish in 4 hours B in 5 hours C in 6 hours...
Is't possible to make the deference appear in the column?