Master the 3-Level Drill Down in Tableau (with Dynamic Zone Visibility)

Вставка
- Опубліковано 8 лип 2024
- This is your guide on mastering the 3-Level Drill Down in Tableau!
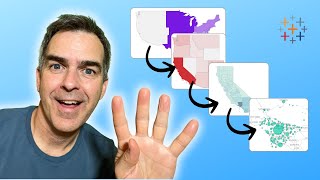
In this tutorial, I show you step-by-step how to make the most of using dynamic zone visibility to create this functionality. We'll go through both scatter plot drill downs from Region → State → Postal code and then replicate that as a bar chart.
You can easily make this a map drill down by changing the chart type. That's it!
🔍 What you'll learn in this video:
1. The basics of drill down functionality in Tableau
2. Hands-on demonstrations, tips, and best practices
3. How to interact with the data
💡 Why is this important?
Drill down capabilities allow analysts to explore data from a broad overview down to granular details. By mastering the 3-level drill down, you can uncover hidden patterns, insights, and trends that might be overlooked in higher-level analyses.
📌 Prerequisites: A basic understanding of Tableau's interface and primary functions will be helpful, but beginners will be able to follow along as well! If you are following along, be sure to pause the video along the way as you repeat the steps.
📚 Resources & Links:
Workbook - public.tableau.com/app/profil...
Blog - www.vizwiz.com/2023/08/dzv-dr...
🙏 Support my channel:
If you find this video helpful, please give it a thumbs up, share with someone you know will find it useful, and don't forget to subscribe for more in-depth tutorials!
For questions, clarifications, or feedback, drop a comment below. I love hearing from you and will do my best to help.
NEWSLETTER
Sign up for my newsletter. Every week I provide advice, tips, live stream videos, discounts on products I create, and much more.
Launch, grow, and unlock your career in data at andykriebel.com/
CONNECT WITH ME
linktr.ee/andykriebel
TABLEAU COACHING
Contact me for more information about 1:1 and group coaching sessions.
coaching@andykriebel.com
ARE YOU INTERVIEWING FOR A NEW JOB?
Contact me for more information about how I can help you prepare for that big interview.
coaching@andykriebel.com - Наука та технологія


I think this was a better tutorial using dynamic zone visibility than the map drilldown.
I used this to make a 3 level map drilldown, was a bit complicated due to some factors in the data (there are a lot of Franklin Counties in the US haha), but I figured it out - main thing was using multiple filters on the zip code drilldown, and using FIP as my county data point rather than county name.
I think the region/state/postal code levels were easier to understand. I did end up using a marks layer but only so I could put the name of the county on the title row, which I thought was a nice touch and good way to keep oriented. And I like the idea of numbering the calculated fields and parameters!
This seems like a great one-stop shop for drilldowns in general. I appreciate the video.
Great video! I applied what I learned to a 4 level drill down and it wasn’t too much extra work after mastering 3 levels!
I hope to reach your level of Tableau mastery, thank you!!
Nice work!
These videos are so helpful and easy to follow -- thanks Andy for all the hard work!
My pleasure!
This is great information, thank you for sharing Andy!
This is great! Thank you!
Hi @vizwiz, Thanks for the great video, I used your method for 3 level drill down, but I don't know how to add the possibility of multi-selection in each level, that is, I want to be able to select several items in each level at the same time instead of selecting one item.
Can you make one for year to month to week to date level please
Cool
Andy can you make a complete tableau beginner to advance tutorial using real world dataset but please ensure dataset is not clean
It's called Udemy dude...for a cup of coffee you can get a course that does just that. Get to work!!
I will make it if you pay me to create it. :-)
This content is amazing btw! If we apply this logic to a 5 level drill down, is there a way to go switch back and forth within interim levels?
There is. I haven’t created any content on it yet.
Great video Andy! Question, can this be done with a map (drill from region to state to zip code)? I have a dashboard I created last year that has a breakdown of each state to zip codes using viz in tool tip, but I think this would be a great option too. My company is a little behind in Tableau versions, so I don't have the ability to test myself yet.
Here you go ua-cam.com/video/BsP1hIXLV64/v-deo.html
this is not 3 level, correct?@@vizwiz
Thank you so much. I needed something to go from state, to county to city in map form and it worked perfectly. I do have a quick question. My three tier consists of state, county, city. When I drill down from a specific county, multiple states show. I am guessing this is because the county field, for example, Jefferson, is attached to multiple states. Since I am still relatively new to Tableau, I am struggling to find a proper function to ensure that only the cities from the specific county in the specific state show. Thanks in advance.
You'll need to include a filter on State most likely in your county level sheet.
Thank you. I added a state filter with the value set to True and it worked. I appreciate the help.
@@chrisallen254 good stuff. Thanks for letting me know.
Another option not mentioned here that is specific to the US is FIPS, which is a 5 digit numerical value for county.
Another great video, Andy!
I had some difficulty sorting out the workbook actions, but that was just about being careful with the source sheets.
Is this functionality supposed to work in stories? I tried adding both dashboards to a story, but they stopped working. Is it me, or is it Tableau?
I’ve never tried it in Stories. I probably haven’t used Stories in 5 years.
@@vizwiz not a big surprise. Just thought I would ask. I seem to have a knack for finding things that don’t quite work the way I except them to.
My company has an older license of tableau--do you have a resource to learn how to do this when we don't have the option to "Control visibility using"?
Upgrade 👍🏻