How to create a table from survey data in Excel | Questionnaires & pivot tables for beginners

Вставка
- Опубліковано 6 вер 2024
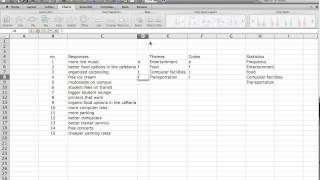
- 1) You have raw data in an Excel sheet.
2) Click once anywhere inside the data.
3) Select the tab Insert and click the button Pivot table.
4) I recommend the option New worksheet.
5) Drag your most important variable into the Values box.
6a) You might have to change the type of value.
6b) Right-click on the value.
6c) If need be, drag down to Summarize Values By and change it.
7) Next, drag the same or another variable into another area (box).
***
If you do not see the Fields and boxes, click one inside the table.
***
One way to proceed is to remove the variables and start all over.
Another way is to click, drag, copy, and paste the table.
To keep the first table, you must remove the old variables.
***
Remember. The raw data are never altered. Pivot tables are non-intrusive.
All we are doing is experimenting. Analyzing.
***
The most important box is Values.
I start by dragging my main variable into that box.
In my video, I investigate the attitude to ice cream.
***
After dragging it to the Values box, I get some summary.
It shows the summary of all replies to that survey question.
However, we do not want the count of. We want the mean value.
Just right-click on the number.
Drag down to Summarize Values By, and select Average.
This is the mean value for all participants answering this survey question.
But it is just the beginning.
This is where Pivot tables shine.
I will now break it down by some other variable.
Let's take the Educational level.
Congratulation!
You have created a table from survey data.
***
I know that you think that the Pivot table function seems complicated.
But that is what everyone thinks. You are not alone.
Keep practicing!
Remember, Pivot tables do not alter the raw data.
It is just a tool. Analyzing data is fun!
You will become an extra valuable employee with your new Excel skills.
***
There is no right or wrong here.
It is all about testing, exploring, and solving problems.
***
Copyright
Text, video, and audio © Kent Löfgren, Sweden


I urgently needed a video on creating pivot tables and I found your video on the first search. I really appreciate the work you are doing, it really helped me understand in a very simple manner. Keep up the good work
Glad to be of assistance. Good luck with your project.
Great teacher here. Thankyou for making me love doing something which was boring and repulsive. Developing a chart is so playsome.
You're very welcome!
This video was really really really useful, thank you so much Kent
Thank you. That's very kind of you. I try to make tutorials that help me.
I really like your teaching style.
Excellent video. Straight to the point!
it's very useful sharing. Thank you very much. Because of your slowly speaking , I understand you easliy . Because I'm turkish. Thansks
Glad to hear that!
Amazing explanation Kent, thank you so much for showing things simply but as well explaining actions more than plain theory. Appreciate it.
Fantastic, thank you so much
Thanks it has really helped with analyzing data and made it much faster.
Thanks, this was a super helpful video!
im just curious of what your are using to zoom out the specific field that you select in this video tutorial>?
Thx for taking time to comment. It's all done (by me) with Adobe's video editing software Premiere Pro. I sometimes also use Techsmith's editor Camtasia, but not in this particular video, which also has a nice zoom in/out function.
@@kentlofgren thank you for the info Mr. Kent..Beginner's here.
Thank you so much! It helps a lot!☺️
You're welcome!
Thank you for this! You explained it well
Glad it was helpful!
Tusen takk.
Varsågod!
How would I should word answers instead of counting answers? Excellent, Good, Fair, Poor, for example?
Hello! Here are some examples:
www.questionpro.com/blog/likert-scale-examples
Lovely video! Thank you!
Lovely explanation. Thank you
You are welcome! Good luck with your table endeavors :-)
Thank you! So easy to follow your instructional tutorial
Glad it was helpful!
Very informative, thank you
Glad you enjoyed it!
The video very usefull, thank you so much
Thanks Kent. Added this to a larning palylist. What screen recording tool do you use for the effects on the boxes that pop up and zoom out again?
Thanks for your comment. You mean those red boxes and circles at, for example, 3:32 ? It's done inside the video editor Premiere Pro. However, it could also be done in the editor Camtasia. In fact, I've begun to use Camtasia more and more because it's easier and faster.
Tnks Kent
My pleasure!
When I want the mean value, right-click on the number and then drag down to Summarize Values By, and select Average it turns all numbers into #DIV/0! Can you please help? :(
Excellent explanation! Thank you very much!
May you share the file?
I would like to practice.
Regards
Thank youuuuuuuuuuuuu ❤❤❤
How did you find this kind of dataset? If possible, can you please give the website?
Good info. Thanks
#knowledgevillage