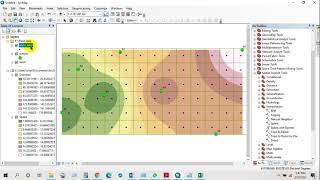
i want to create a spatial image from 2017-2022 .. but some stations doesn't have any "null value " .. in the xy display ... the z field does not show these year which have null value....... what i should? no spatial image is created for the year which having null values
Hi Thanks for the tutorials everytime👏. Can I ask if you make a tutorial on how to create a 25km radius from the center of a metropolis in a square boundary? Something like this
Thank you for the tutorial, But please try and drop the data used during the tutorial so we can practise alongside. i have watched over 10 of your videos and its sad you don't drop link to download the data to practise alongside
In IDW only known z values and distance weights are used to determine unknown areas. Kriging is most appropriate when you know there is a spatially correlated distance or directional bias in the data. IDW is simpler than kriging because it calculates that unknown values based on the average, but kriging is advanced used when the spatial correlation is found and used in many fields with high accuracy than IDW So, I think you can use Kriging method. Best wishes.
Thank you sir, for this wonderful video, now how can I really explain theses results to some one looking at the maps of the different parameters concentration?
how can I input 12months Rainfall/Radiation/solar data in one map, I am truly unable to formatting the excel file table. could not find proper data file with what I can make desired maps. please make any or suggest anything. urgently plz
How to export many maps in only one jpeg file like the one you make in the word file presented in the video? as i export every map alone and don't know how to collect them in one piece
Dear sir, could you please make a video of spatial representation of the monetary value (in money) of ecosystem services of a city? Your videos are truly helpful to me regards
The two mentioned techniques: IDW and kriging are also known as Kriging techniques, the simple for IDW and the ordinary Kriging for the latter. Although both techniques depending on the distance between the two points, the observed and the estimated one in the interpolation, the IDW weighted the contribution of the observed points on the estimated interpolation just regarding to this distance. On the other hand, ordinary kriging also considers the correlation between the points and forms an initial function (i.e. covariance, variogram) which is can iteratively be updated. For evaluating the accuracy, in case of IDW, the leave-one-out technique is preferable while in case of using the ordinary kriging the estimated prediction error variance can be estimated according to the prior minimized condition used. To sum up, IDW can be used when there is no prior knowledge about the correlation between the points and there is a good distribution of observations. Ordinary kriging is better to use for expert users and if the spatial correlation is figured.
Kriging is an efficient interpolation method helps in reducing prediction error. An IDW interpolation is one of the simplest and most popular interpolation techniques for continuous variable modeling. To compare the quality of prediction obtained from ordinary kriging and IDW , you can use performance evaluation measures: root mean square error (RMSE)
how to make multiple map in one layout an one legend? can you Help me? i already have 3 shp with different classes that want to layouting in one legend,,. thank u before
I like your channel. It is so helpful.. But please help me..I had followed step by step ..and after running the interpolation tool the error 999999 had appeared and I tried several times it didn't work. .what is the reason
The rhythm is too slow, with too many unneeded details that make me uninterested where the plot is lost in the details of data conversion and excel formatting which doesn't belong to this video and makes the audience lose interest and don't follow anymore. and Why did you use Kriging and not IDW for interpolation or not even Natural trend? Kriging is not a good selection here because the distribution of these elements is dependent on many covariables in the landscape that should be included in the model producing the surface and accordingly interpolation method should be a multivariable model such as GLM or GAM and not Kriging. Kriging is just the easy option because it is available as a ready-made tool in ArcGIS but scientifically the process is null to represent the distribution of the parameter.


Your detailed description. makes you best one talks about ARCGIS
Movies in arcgis 😂
A great brother.. it was an awesome video.. as well as the background of the sino-danish institute.
You are welcome. Please keep in touch.
I wish it would be a plugin that making all metals distribution map at the same time. Because there are 6 metal map too.Great job. Thanks
i want to create a spatial image from 2017-2022 .. but some stations doesn't have any "null value " .. in the xy display ... the z field does not show these year which have null value....... what i should? no spatial image is created for the year which having null values
Well explained 💯
thanks
hello sir i need fast reply...why my z value doesnot contains the field while kringing there isnot options as your can you help me
Thanks for your recordition the tutorial
You're welcome
Hi Thanks for the tutorials everytime👏.
Can I ask if you make a tutorial on how to create a 25km radius from the center of a metropolis in a square boundary?
Something like this
Thank you for the tutorial, But please try and drop the data used during the tutorial so we can practise alongside. i have watched over 10 of your videos and its sad you don't drop link to download the data to practise alongside
Kindly upload some videos on study of climate change through ArcGIS
Which method IDW or Kriging would be more suitable for Air pollutants(PM 10 PM 2.5) visualization
In IDW only known z values and distance weights are used to determine unknown areas. Kriging is most appropriate when you know there is a spatially correlated distance or directional bias in the data.
IDW is simpler than kriging because it calculates that unknown values based on the average, but kriging is advanced used when the spatial correlation is found and used in many fields with high accuracy than IDW
So, I think you can use Kriging method. Best wishes.
Thank you sir, for this wonderful video, now how can I really explain theses results to some one looking at the maps of the different parameters concentration?
how can I input 12months Rainfall/Radiation/solar data in one map, I am truly unable to formatting the excel file table. could not find proper data file with what I can make desired maps. please make any or suggest anything. urgently plz
@@shahidsulaiman8349 actually, it is urgent. Stuck middle of my research..Thank you..i will..do u have his email?
How to export many maps in only one jpeg file like the one you make in the word file presented in the video?
as i export every map alone and don't know how to collect them in one piece
Please check my other videos. You Will find. Thanks
Dear sir,
could you please make a video of spatial representation of the monetary value (in money) of ecosystem services of a city?
Your videos are truly helpful to me
regards
As soon as possible, I will upload.
Sir, can you create a map for water quality monitoring for temporal base using Arc or Q GIS
How to do accuracy of idw?
Please do make video on spatio temporal map
Already upoaded a spatio temporal map in this channel. You can check it out.
Can you Please Tell Me How I Can Collect Air quality sample from different sites? Is there any instrument or apparatus? Plss Answer 🙏
kriging or idw has same result?
The two mentioned techniques: IDW and kriging are also known as Kriging techniques, the simple for IDW and the ordinary Kriging for the latter. Although both techniques depending on the distance between the two points, the observed and the estimated one in the interpolation, the IDW weighted the contribution of the observed points on the estimated interpolation just regarding to this distance. On the other hand, ordinary kriging also considers the correlation between the points and forms an initial function (i.e. covariance, variogram) which is can iteratively be updated.
For evaluating the accuracy, in case of IDW, the leave-one-out technique is preferable while in case of using the ordinary kriging the estimated prediction error variance can be estimated according to the prior minimized condition used.
To sum up, IDW can be used when there is no prior knowledge about the correlation between the points and there is a good distribution of observations. Ordinary kriging is better to use for expert users and if the spatial correlation is figured.
Kriging is an efficient interpolation method helps in reducing prediction error. An IDW interpolation is one of the simplest and most popular interpolation techniques for continuous variable modeling.
To compare the quality of prediction obtained from ordinary kriging and IDW , you can use performance evaluation measures: root mean square error (RMSE)
thank you for your information...success
@@nandarbanjar6303 You are welcome.
Please how can I get the software you used for tye analysis?
How can do idw interpolation of -ve valued data , please guide 🙏
how to make multiple map in one layout an one legend? can you Help me? i already have 3 shp with different classes that want to layouting in one legend,,. thank u before
I need this for my thesis
I like your channel. It is so helpful..
But please help me..I had followed step by step ..and after running the interpolation tool the error 999999 had appeared and I tried several times it didn't work. .what is the reason
Try again please after restating your computer.
How get data !
Try to upload more videos if possible
Yeah, I'm trying brother. Please keep in touch and thanks for your concern. 😇
Can you add the data for us to try it out?
sure. Please write here your email. I'll send you soon. Thank you.
Send data pleas
dawuem@gmail.com
UCAS campus Yanqihu !!
The rhythm is too slow, with too many unneeded details that make me uninterested where the plot is lost in the details of data conversion and excel formatting which doesn't belong to this video and makes the audience lose interest and don't follow anymore. and Why did you use Kriging and not IDW for interpolation or not even Natural trend? Kriging is not a good selection here because the distribution of these elements is dependent on many covariables in the landscape that should be included in the model producing the surface and accordingly interpolation method should be a multivariable model such as GLM or GAM and not Kriging. Kriging is just the easy option because it is available as a ready-made tool in ArcGIS but scientifically the process is null to represent the distribution of the parameter.
could you send your email I need it, thanks
islamshafiquldm@gmail.com