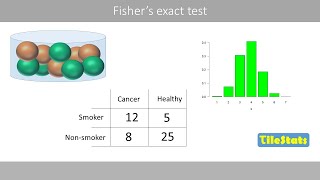
Thanks for the video. I just wanted to point out that the first slide has a minor error. It says the Exact Test should be used when fewer than 80% of the expected counts are less than 5. This is not correct. The Fisher Test should be used when fewer than 80% of the expected counts are more than 5. This is the same as saying that more than 20% of the expected counts are less than 5. There is also a rule of thumb that the Exact Test should be used if any of the expected counts are less than 1.0. Of course, the Fisher Exact Test can be used when the expected counts are higher than this. Anyways, I thought the video was very helpful in understanding this topic. Thanks.
Jason, I have a dataset a=3, b=1, c=40, d=114. Only one count from 4 is under 5. Fisher p=0.06172464. But for data 6,2,80,228 p = 0.00606172. So there is 10 times different p value for 2 times bigger dataset or for sum of group under and over 5. Barnard test showed me 0,037 for first dataset 3,1,... and for 6,2,.... p = 0,0034. Also 10 times smaller, but under "magic" p = 0,05. So what is optimal count size for Fisher test? This is real medical example. Hrncir is name based on Czech name Hrnčíř? :)
Hi this is very useful. Is there a more programmatic way of adding the probabilities for the two tailed test? i.e the probabilities less than the cut-off p? I'm trying to do in excel for multiple tests. Thanks


This is legit; I have been meaning to figure out how to easily generate that possible combinations! Thanks mate! Very useful!
Thanks for the video. I just wanted to point out that the first slide has a minor error. It says the Exact Test should be used when fewer than 80% of the expected counts are less than 5. This is not correct. The Fisher Test should be used when fewer than 80% of the expected counts are more than 5. This is the same as saying that more than 20% of the expected counts are less than 5. There is also a rule of thumb that the Exact Test should be used if any of the expected counts are less than 1.0. Of course, the Fisher Exact Test can be used when the expected counts are higher than this. Anyways, I thought the video was very helpful in understanding this topic. Thanks.
Jason, I have a dataset a=3, b=1, c=40, d=114. Only one count from 4 is under 5. Fisher p=0.06172464. But for data 6,2,80,228 p = 0.00606172. So there is 10 times different p value for 2 times bigger dataset or for sum of group under and over 5. Barnard test showed me 0,037 for first dataset 3,1,... and for 6,2,.... p = 0,0034. Also 10 times smaller, but under "magic" p = 0,05. So what is optimal count size for Fisher test? This is real medical example.
Hrncir is name based on Czech name Hrnčíř? :)
Hi this is very useful. Is there a more programmatic way of adding the probabilities for the two tailed test? i.e the probabilities less than the cut-off p? I'm trying to do in excel for multiple tests. Thanks
Hi man! Thanks a lot for this video! It helped so much. Just one question. The final result on this example, it is the two-tailed test right?
Hi Stokes. Can this be applied to a 3x3 (or more) contingency table? Can we also do post-hoc tests?
Answer to the first question is YES. Second question is NO.
Thx mate, very useful :)
they always say use fisher test when sample size is small but nobody really agrees what small is exactly equal to?
what about a bilateral test?
LIFE SAVER THANK YOU
Hi, would you please share this excel sheet?
Lucy zhang I will do so this weekend. Stokes Baker
En castellano por fa