
- 11
- 279 148
Stokes Baker
United States
Приєднався 5 січ 2013
A collection of tutorial on using Excel in statistical analysis
Linear Regression with Excel to produce a standard curve
A tutorial on how to use Excel's linear regression tools to produce s standard curve.
Переглядів: 2 863
Відео


Relative Frequency Polygon with Excel
Переглядів 6 тис.5 років тому
Contains click-by-click instructions on how to make a relative frequency polygon using Microsoft Excel.

Receiver Operating Characteristic Curves with Excel Histogram Function
Переглядів 10 тис.7 років тому
Tutorial on how to use MS Excel 2016 histogram function to create a receiver operating characteristic curve. A similar video using Excel's pivot table function is posted at ua-cam.com/video/EQASA00NQgM/v-deo.html.


Fisher Exact Test
Переглядів 32 тис.7 років тому
Fisher exact test is used to analyze categorical data when the sample size is small. The video shows how to perform Fisher exact test calculations with Excel.

Receiver Operating Characteristic (ROC) Curves with Excel Pivot Table Function
Переглядів 95 тис.7 років тому
This videio will cover: * what is a receiver operator curve. * how to interpret a receiver operating characteristic curve. * how to perform the calculations with Excel. * how to graph the results with Excel. Excel's pivot table tool is used to create a frequency distribution table. Another way to create the table is to use Excel's histogram tool. A video on how to create ROC curves using the hi...
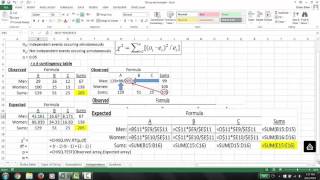
Chi-square Tests with Excel
Переглядів 49 тис.8 років тому
A demonstration on how to conduct a test of independence and a goodness of fit chi-square test using Excel.

Two sample t-tests Excel
Переглядів 18 тис.8 років тому
A tutorial showing how to use the Excel Data Analysis Tool-pak to conduct two sample t-test assumung unequal variance or equal variance. Paired observations t-test are also covered.

One-sample t-test with Microsoft Excel
Переглядів 3,9 тис.8 років тому
A short tutorial on how to use Excel 2013/365 to calculate a one-sample t-test. Table of Contents: 00:00 - Introduction 00:10 - Assumed background
Bar Graphs with Confidence Intervals in Microsoft Excel
Переглядів 43 тис.8 років тому
A demonstration on how to create bar graphs with 95% confidence interval range bars. Table of Contents: 00:00 - Introduction 00:09 - Assumed background 00:28 - What are confidence intervals? 01:26 - Example
Line Graphs and Bar Graphs with Confidence Intervals Using Microsoft Excel
Переглядів 20 тис.8 років тому
Demonstration on how Excel can be used to create line graphs and bar graphs containing confidence intervals. Table of Contents: 00:00 - Introduction 00:13 - Assumed background
Hi Can you please tell us if two x axis values can be analyzed on the same roc
I just wanted to know what number I have to put in the frequency box SMH
Hi this is very useful. Is there a more programmatic way of adding the probabilities for the two tailed test? i.e the probabilities less than the cut-off p? I'm trying to do in excel for multiple tests. Thanks
from were we need to take the data
I do not understand your question. SSB
great explanation! thank you :)
THANK YOU!
I am glad to video was helpful.
Thank you so much. Your video is very useful.
I am glad it was helpful. SSB
Hi, this is so easy, thank you so much! I had the coordinates but didn't know how to plot the curve. One question, how can I insert the middle line in the graphic? Thank you soooooooooo much!!!
What do you mean by midline?
@@stokesbaker5907 I meant the line of the null hypothesis, I found out how to do it, thank you!
@@jusarquiscould you tell me how you inserted the middle line?
HI IS AUTOPSY RESULTS THE CONTROLS OR ?
The autopsy results are that are used to determine sensitivity and specificity.
Can we draw multiple roc curve in a single graph
There should be no problem doing that.
Yes. Click the "Select Data" button and then the "Add" button.
Thank you very much for this very informative and detailed video it was vey helpful
You are amazing. Thank you
Thank you for the compliment.
they always say use fisher test when sample size is small but nobody really agrees what small is exactly equal to?
Thank you very much! This was a life saver!
I am glad the video was helpful.
Thank you, clear and simple example.
Thankyou Mr. Baker!!
I'm glad the video was helpful.
Hi man! Thanks a lot for this video! It helped so much. Just one question. The final result on this example, it is the two-tailed test right?
Could you please explain how did you calculate sensitivity and specificity values
You have explained everything so clearly. Thank you for making this video. I am no longer tearing my hair out in frustration 😁
Thank you for your kind words. SSB
fantastic sir, thank you so much sir
Thank u sir... ur work helped me a lot in my thesis work...
Great tutorial! Thank you. Is there a way to get the best accuracy cut off, not necessarily corresponding to one of the BMI values, but also in between them? For example, could the best accuracy point be 34.6, for example, and some automatic calculation bring this information?
I will look into your question and respond soon. SSB
Thank you for your reply but I am still confused, in a case where you have a gold standard and the device you are testing, which one has results that are labelled as healthy/not healthy (like autopsy results), and which one has values (like BMI)
Hi Stokes, thanks a lot for the video, it is very helpful. However I saw in another UA-cam video that says N > 20 and expected cell counts >= 5 in less than 80% of the cells (categories). I am a bit confused now. here is the link ua-cam.com/video/jwkP_ERw9Ak/v-deo.html
I'm literally sitting here crying because I'm trying to watch this video and follow along and I'm so lost... I have to submit this today and I am so confused.
It was VERY helpful!!!! Thank you very much
I'm glad it was helpful.
This is legit; I have been meaning to figure out how to easily generate that possible combinations! Thanks mate! Very useful!
thank you so much..
very helpful!! Thanks
I am glad it helped. SSB
Amazingly pedagogic! Thank you!
Thank you for your very kind comment.
Hello I am having airborne dust concentrations data for >1 micron size, >3 micron, 5 micron and >10 micron size. (> means greater than) These data was taken before and during dust producing work in field study. N=5 How can i compare these before and during operations data ? It seems that there is relative percent variation in dust concentrations in atmosphere between before and during operation data. (Taking >1) micron as 100 %) Before operation: The relative percent variation of concentration with different particle size is as below. For example Concentration of >1 micron size particle is 100%. >3 micron: 80% >5 micron : 60% >10 micron: 40%. During operation: Concentration of >1 micron size particle is 100%. >3 micron: 90% >5 micron : 80% >10 micron: 70%. It seems that >10 micron particle share is increased due to that machine operation...? Which test is suitable for analysing these type similar data for discussion ? How to use statistics? Any comparison among these concentrations of different particle sizes ? thank u.
Thanks very much, you are great to share it!!!! I was needing it!
I'm glad you found the video helpful.
This is posted 4 years ago! Just used it now. Out of so many videos I watched, this is by far easy to understand and very insightful. Thank you!
I'm glad it was helpful.
Stokes Baker Thank you so much! Very helpful!
This was amazing and so helpful thanks so much! I would highly recommend
I am glad I got help.
I am glad you found the video helpful.
Note: he is using confidence.t because of n < 30 otherwise you can use confidence.norm.
Very very helpful! Thank you so much for all of the details!!
Thx mate, very useful :)
Hi Stokes. Can this be applied to a 3x3 (or more) contingency table? Can we also do post-hoc tests?
Answer to the first question is YES. Second question is NO.
It's the middle of the night and I'm writing my master thesis and doing statistical analysis. You sir just saved my life. I can't thank you enough
Too late to ask, but how did your thesis defense went ?
@@Celestiallev hey thanks for asking! I scored the maximum!
I am glad it was helpful.
thank you for this tutorial, it helps me to help someone who needs this tutorial :D
I am glad it helped. SSB
LIFE SAVER THANK YOU
Thanks for the video. I just wanted to point out that the first slide has a minor error. It says the Exact Test should be used when fewer than 80% of the expected counts are less than 5. This is not correct. The Fisher Test should be used when fewer than 80% of the expected counts are more than 5. This is the same as saying that more than 20% of the expected counts are less than 5. There is also a rule of thumb that the Exact Test should be used if any of the expected counts are less than 1.0. Of course, the Fisher Exact Test can be used when the expected counts are higher than this. Anyways, I thought the video was very helpful in understanding this topic. Thanks.
Jason, I have a dataset a=3, b=1, c=40, d=114. Only one count from 4 is under 5. Fisher p=0.06172464. But for data 6,2,80,228 p = 0.00606172. So there is 10 times different p value for 2 times bigger dataset or for sum of group under and over 5. Barnard test showed me 0,037 for first dataset 3,1,... and for 6,2,.... p = 0,0034. Also 10 times smaller, but under "magic" p = 0,05. So what is optimal count size for Fisher test? This is real medical example. Hrncir is name based on Czech name Hrnčíř? :)
Very useful!
Very helpful. Thanks a lot.
Thank you for your video, it is very helpful!
Thank you very much! Do you know how to calculate the area bellow the ROC curve using Excel?
Old timer's trick is to use a see scale to estimate the area under the curve. Cut out a know are (e.g. 10 x 10 = 100 sq units). Then cut out the desired area under the curve. The first is used to convert surface area to grams. The mass of area under the curve divide by g/sq units = surface area under the curve.
@@stokesbaker5907 can you classify more on how to calculate the area under the curve plz?
thank you
Can u share ur data set with me so i can follow ur example correctly.... However your video is great
very useful....thankyou for the video
Thanks. It's a nice explanation.
Why is the sum, on the right observed grid, different to the one on the left..is that an error?
How can it add up to 99 or 106? Cheers