Probabilities from density curves | Random variables | AP Statistics | Khan Academy

Вставка
- Опубліковано 6 вер 2024
- Courses on Khan Academy are always 100% free. Start practicing-and saving your progress-now: www.khanacadem...
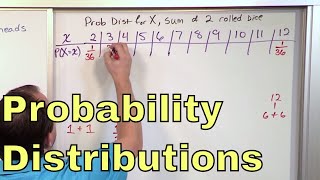
Examples finding probabilities from probability distributions for continuous random variables.
View more lessons or practice this subject at www.khanacademy...
AP Statistics on Khan Academy: Meet one of our writers for AP¨_ Statistics, Jeff. A former high school teacher for 10 years in Kalamazoo, Michigan, Jeff taught Algebra 1, Geometry, Algebra 2, Introductory Statistics, and AP¨_ Statistics. Today he's hard at work creating new exercises and articles for AP¨_ Statistics.
Khan Academy is a nonprofit organization with the mission of providing a free, world-class education for anyone, anywhere. We offer quizzes, questions, instructional videos, and articles on a range of academic subjects, including math, biology, chemistry, physics, history, economics, finance, grammar, preschool learning, and more. We provide teachers with tools and data so they can help their students develop the skills, habits, and mindsets for success in school and beyond. Khan Academy has been translated into dozens of languages, and 15 million people around the globe learn on Khan Academy every month. As a 501(c)(3) nonprofit organization, we would love your help! Donate or volunteer today!
Donate here: www.khanacadem...
Volunteer here: www.khanacadem...


nice and succinct and quick examples with clear explanations.
i was learning this at my add maths tuition and then when i opened youtube, khan uploaded this vid seconds later! gr8
Can somebody answer where the 0.25 value came in the Y value in the density curve please ???
0.25 is the probability density value, in this case they all have 0.25 values. hope that helps a year later :)
What numbers are calculated to get the 34%, and the 50%. This is where I get confused, when there is not a clear path on what numbers will be computed to get the answers. Also, why is everything under the curve added up to 1?
Please
WhatsApp is the software you are using to do this video ?
What
how is that 34% ??
Diana Ica he's said P between sd below the mean and sd above the mean roughly 68.2% in normally distributed. I'm not sure wait for correct answer.
James
You are correct
James thanks for the answer :)
Diana Ica you are welcome
how did he calculate 68.2 ?
IM THE SECOND COMMENT
I can cure cancer now.