Це відео не доступне.
Перепрошуємо.
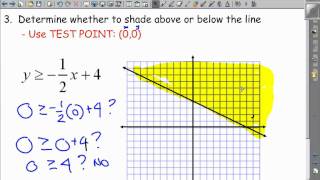
3 4 Day 1 B Graphing Inequalities and calulating Max and Min

Вставка
- Опубліковано 30 сер 2013
- This video explains how to graph a system of inequalities and calculate the maximum and minimum values for the bounded region.


This truly helped me was struggling to understand
Great video thanks for the help!
Goat teacher
I love you joshua thank you so much
you are my hero
Thank you so much for this explanation😄
this was really helpful.thanks!
Great video! Thank you soo much!!!
Thank you!
great thanks for the man
keep up the good work
You saved me man thanks
thank you
V.nice explanation
thanks
u didnt have the draw each shaded part. it makes it confusing to read the graph and find the vertices
doing great job
i misclicked so i heard "hi welcome to this....half of a triangle" i was yawning
Made a slight mistake
Boonk