Hola Amigo, muchas gracias por compartir tus conocimientos e ideas, estoy trabajando desde hace poco como Back Office después de haber estado 3 años sin trabajo y en este momento, mi experiencia más las ideas que entregas, me han ayudado mucho a ganar visibilidad y estabilidad en mi trabajo. un abrazo desde Santiago de Chile.
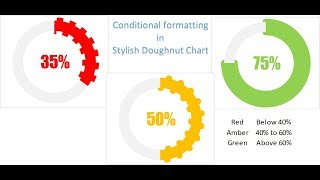
Hi, many thanks for the video. I have a question, how can I have it display a negative value specifically to highlight a profit margin loss? The doughnut chart that I have only shows the progress go clockwise and not counter-clockwise if you know what I mean.


you are the BEST, most creative Excel EXPERT on youtube!
Thanks for your valuable feedback
Please create some more such beautiful charts. They're very presentable and worth learning
Sure, Thanks
Amazing! Great idea to make visually appealing KPI 👍
Thank you so much just saved me so much work.
Thanks for your valuable feedback
Excellent explanation , thank u ❤
Most welcome
My friend, all your wonderful lessons Thank you so much, I'm sorry I have not followed you before.
Thanks for your valuable feedback
Thank you. You made my day
Thanks for your valuable feedback
Beautiful and amazing
Thanks🙏
Hola Amigo, muchas gracias por compartir tus conocimientos e ideas, estoy trabajando desde hace poco como Back Office después de haber estado 3 años sin trabajo y en este momento, mi experiencia más las ideas que entregas, me han ayudado mucho a ganar visibilidad y estabilidad en mi trabajo. un abrazo desde Santiago de Chile.
Simple, neat and effective.
Thanks for your valuable feedback
Excellent, thank you
Most welcome
Love your videos!! Plenty of ideas for my presentations.
Thanks for your valuable feedback
Mr. Kumar You are excellent....
Thanks Ashish for your valuable feedback
Thank you so much....fantastic!
Thanks for your valuable feedback
just amazing , keep going
Excellent trick.. Thank you... Hoping more tricks from you...
Thanks for your valuable feedback
Awesome excel trick!!... really very helpful!!👍
Thanks Satish
One's more awesome work done ...
Keep them coming PK ...
Thanks Rohan, for your valuable feedback
Excellent
Thanks
Thanks for your valuable feedback
very smart, very beautiful, you are doing great man.tnx
Thanks for your valuable feedback
Excelent work PK!! Thank you so much
Thanks for your valuable feedback
I like this video sir . Very nice video
You are just awesome
Thanks for your valuable feedback
You are a genius
Thanks for your valuable feedback
As always, Great! Thanks PK.
Which software do you use to create these tutorials?
Amazing :) Thank you!
Thanks for your valuable feedback
My pleasure :)
Bravo
Thanks
Very nice bro
Thanks for your valuable feedback
Very Nice !
Thanks for your valuable feedback.
Awesome presentation. Can we do the same in Power BI?
I will try to create this in Power BI in a saparate video:
Very good pk...
Another good presentation
And congratulations for 20k subscribers....
Thanks Pawan for your valuable support to my channel.
PK, is there any trick to have rounded corners at the end points of doughnut part showing actual performance?? Food for your mind!
Nice Question Satish. I will definitely try to make such video very soon.
Super
Thanks for your valuable feedback
awesome
Thanks for your valuable feedback
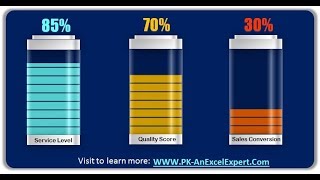
Will this donut work when the SL percentage more than 100%. For instance 110%
Super:)
good one..
Thanks Durgesh for your valuable feedback
Hi, many thanks for the video. I have a question, how can I have it display a negative value specifically to highlight a profit margin loss? The doughnut chart that I have only shows the progress go clockwise and not counter-clockwise if you know what I mean.
I will definitely try to make such video very soon. Thanks for watching
Very nice one. Can we put this to PPT as well? If yes please let me know
Hello Sir, Awesome GRaph again.... Can we create a similar graph to show GREEN color if SLA% goes above 80% else it should be RED or Orange ???
Thanks for your valuable feedback. Please watch below given video. It will help you.
ua-cam.com/video/RGUlgeoOb1I/v-deo.html
I have a situation where my target is more than 100% then how to show the same in all doghnut chart
Awesome sir..I hv bn following ew 4m couple of months..do you have any full time excel course?
Thanks for your valuable feedback.
Please visit my website to learn more.
Www.pk-anexcelexpert.com
PK: An Excel Expert wow... complete course is der.. but hats off for your creativity.. never thought of happening such things in excel
Change series is not working in 2010 excel
Shame u have so many dam
Adverts on here I switched off too soon !!