JMeter Beginner Tutorial 27 - How to Monitor Server Health with PerfMon | How to add PerfMon

Вставка
- Опубліковано 6 лют 2025
- website - automationstep...
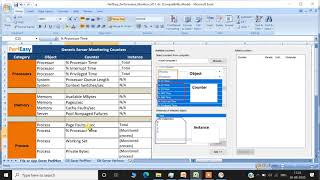
PerfMon
Today we will learn:
1. How to add PerfMon plugin in JMeter
2. How to start PerfMon server
3. How to monitor server health with JMeter PerfMon plugin
Response
Time
Avg Time
Connect Time
Size
Bytes
Server - machine where your test application is hosted
CPU, Memory, Disk I/O, Network
10000 users
9000 users, high CPU usage
Suggest hardware infrastructure
Step 1 : Add perfmon plugin in JMeter
1. Download and add to JMeter lib and ext folder jmeter-plugins...
2. Plugins Manager
Step 2 : On server
Download perform server agent github.com/und...
Step 3 : Start the perfmon server agent
Mac/linux - terminal - sh startAgent.sh
Windows - startAgent.bat
Check client can talk to server via port 4444
Step 4 : Create JMeter test to monitor Server Health
Step 5 : Run and Validate
#JMeterPerformanceTesting #JMeterTutorials #JMeterTraining #JMeterPerfMon
JMeter Beginner - bit.ly/2oBbtIU
JMeter Intermediate - bit.ly/2oziNVB
JMeter Advanced - bit.ly/2Q22Y6a
JMeter Tips & Tricks - bit.ly/2NOfWD2
Performance Testing - bit.ly/2wEXbLS
UA-cam PLAYLISTS
/ @raghavpal
UA-cam
/ automationstepbystep
FACEBOOK
/ automationstepbystep
TWITTER
/ automationsbs
If you like videos on the channel Automation Step by Step, hit the like button and share with others.
Click the SUBSCRIBE button and hit the bell icon to keep getting new videos.
_______ ONLINE COURSES TO LEARN _______
Visit - automationstepb...
Never Stop Learning
Raghav


Online courses & Training - automationstepbystep.com/
Many thanks Raghav! as usual you bring amazing tutorial please continue.
Gald to know this.
Very informative... The way you explain things are superb...
Thanks and welcome
Thanks Raghav.It is really helpful
Most welcome Rabaya
Hi Raghav, Will you kindly record a session explaining What is Memory Leakage and Out of Memory issues while executing our performance tests in JMeter. Thanks.
I will plan
Yes.. This session is very helpful
Thank you sir 😊
You're welcome Dileep
I like your video...it is easy to understand
Thanks Utkarsh
Hi Raghav, Thanks for this series of Jmeter, really appreciate the efforts & commitment to explain everything in detail. :) Just wanted to understand that what happens when the same test is run in non-GUI mode. will this perfmon plugin will be responsible for consuming the system's memory as well. And will it also impact any other metrics?
Hi Rajan, I believe the creators have taken care of this and the memory consumed by the plugin should not impact the sampler results
Thanks Raghav👍🏽
Also , for application on AWS based instance the port number 4444 should still work??
It depends on how the security groups are configured
thannnnnnnkuuuuuuu very much sir
Sir i want to join ur chanel
Sure Danish
HI Raghav your video is too clear to understand. problem m facing is when I start JMeter script targeted server agent is getting stopped hosted server is different location
You will need to check with your team so that the client and server systems are visible to each other over a network
@@RaghavPal have checked that both servers can communicate easily and i can also test commands from system 1 to system 2 with telnet command but still server agent is getting stopped
Will need to check system & network logs, Take help from your NetOps team
Hi Raghav, i want to test and configure health and other testing steps on the dedicated sever how can I done this using JMeter kindly help me out this I'm stuck on this, I won't able to test and perform load and stress testing on the dedicated server. is there any tool or something in the Jmeter that done these performance testing.?
Ammar
Certainly! To perform load and stress testing on a dedicated server using Apache JMeter, follow these steps:
1. Install JMeter:
- Install JMeter on your local machine. You can download the binaries from the official site¹.
- Ensure you have Oracle Java or OpenJDK (version 6 or later) installed.
2. Create a Test Plan:
- Open JMeter and create a new test plan.
- Add a "Thread Group" to simulate users.
- Within the thread group, add samplers (e.g., HTTP Request) to define the actions you want to test (e.g., hitting specific endpoints).
- Configure listeners (e.g., View Results Tree) to collect performance data.
3. Configure Server-Agent (for monitoring server performance):
- Install `server-agent` on your tested application server.
- Edit the `jmeter.properties` file:
```
remote_hosts=xxx.xxx.xxx.xxx:4444
```
Replace `xxx.xxx.xxx.xxx` with the IP address of your tested server.
- Start your test from any machine and monitor server performance using the `jp@gc-Perfmon Metrics Collector` listener
4. Run Tests:
- Execute your test plan against the dedicated server.
- Observe performance metrics, analyze results, and identify bottlenecks.
Remember to adjust the test plan according to your specific application and requirements
-
Hi Raghav,
I want to perform load test, Just want to make sure All software should be install in server where service/Application is deployed ? Or i can call through my local also? Need to check performance/CPU/memory all details..
Hi Mitesh, for PerfMon, you will need to provide your server details and it will capture the metrics
Raghav, your tutoring skills is top-notch, very clear with good examples. How can we create graph or HTML report for perfmon output file (csv)
Hi Ade, we can create HTML dashboard reports using a csv file as explained in this video, However I am not sure if this will work for perfmon results or not. Pls give it a try - ua-cam.com/video/aHV5IizW7u4/v-deo.html
Hello when we are doing performance testing using Jmeter normally then also we are checking server health so why should we check this plugin ?
What is the difference .
Let me know
Thanks
Chandrima
When conducting performance testing using JMeter, monitoring server health is indeed crucial. However, there's a difference between monitoring server health directly and using a plugin. Let me explain:
1. Monitoring Server Health Directly:
- When you monitor server health directly, you typically use system-level monitoring tools (outside of JMeter) to collect metrics related to CPU usage, memory, disk I/O, network traffic, and other system resources.
- These tools provide real-time insights into the overall health of your servers, allowing you to identify bottlenecks, resource exhaustion, and potential issues.
- Examples of system-level monitoring tools include:
- Prometheus and Grafana: Used for collecting and visualizing metrics.
- New Relic: Provides application performance monitoring (APM) and infrastructure monitoring.
- Nagios: Alerts you when predefined thresholds are exceeded.
- Zabbix: Monitors various aspects of servers and network devices.
2. Using JMeter Plugins for Monitoring:
- JMeter plugins extend JMeter's functionality by adding features not available out of the box.
- Some JMeter plugins specifically focus on monitoring aspects during load testing:
- Server Performance Monitoring (PerfMon) Plugin:
- This plugin allows you to collect server metrics directly from within your JMeter test plan.
- It measures CPU usage, memory, disk I/O, and network metrics during test execution.
- You can add PerfMon Metrics Collector elements to your test plan, specifying the servers and metrics to monitor.
- The advantage is that you get performance data alongside your load test results, making it easier to correlate performance bottlenecks with specific test scenarios.
- Response Times Over Time Plugin:
- While not directly monitoring server health, this plugin helps visualize response times over the duration of your test.
- It provides insights into how your application's performance changes under load.
- By analyzing response times, you can indirectly infer server health.
- Throughput Shaping Timer Plugin:
- Although not strictly a monitoring plugin, it helps control the load generated by JMeter.
- By shaping the request rate, you can simulate realistic user behavior and observe how your server responds.
- Proper load shaping contributes to better server health assessment.
3. Key Differences:
- Direct Monitoring:
- Uses external tools.
- Provides comprehensive system-level metrics.
- Requires separate setup and configuration.
- Data is collected independently of JMeter.
- JMeter Plugins:
- Integrates monitoring within JMeter.
- Focuses on specific metrics relevant to load testing.
- Simplifies correlation between load and performance.
- Metrics are part of JMeter test results.
In summary, both approaches have their merits. Direct monitoring gives a holistic view of server health, while JMeter plugins offer convenience and context-specific metrics during load testing. Consider your specific requirements and choose the approach that best suits your needs
--
Amazing video thank Raghav. How to find memory Leakage using Jmeter
Hi Vishwanath, Perfmon may help - ua-cam.com/video/xG3mVsXzCCo/v-deo.html
Thank you so much. It is very usesful.
You're welcome Balachandran
Hi Raghav. I successfully installed Jenkins, started ServerAgent, installed the PerfMon plugin, etc...but when I tried to start the test, I received 403 - Forbidden. I've also added HTTP Auth manager to the request sampler with basic authorization (username and password from Jenkins) but this didn't resolve the issue. Any advice? Thanks in advance.
Hi Slobodan,
It is possible that the PerfMon Metrics Collector listener is not authorized to access the server-side performance metrics. To resolve this, try the following steps:
Verify the credentials you are using in the HTTP Auth Manager. Ensure that the username and password are correct and have the necessary permissions.
Check if your firewall is blocking the connection between JMeter and Jenkins. Ensure that the firewall is not blocking the required ports.
Try to access the URL for PerfMon Metrics Collector directly in a web browser using the same credentials you are using in JMeter. This will help you determine if there is a problem with the URL or with the credentials.
Check the logs on both Jenkins and JMeter for any error messages that may indicate the source of the problem.
Ensure that the version of the ServerAgent and the PerfMon plugin are compatible with the version of Jenkins you are using.
If none of the above steps solve the problem, consider seeking assistance in the Jenkins or JMeter community forums.
hi Raghav, thanks for information, while testing we have perfmon, jvisualVM, so we analyze, server health and memory leak.
but after launching if our application is crashed how we will find issue, how we will take decision, where is problem, exactly what we will do
Hi, in general, on the testing phase our job is to find the performance issues and inform the dev, network and any other concerned teams of the result, so that they can further investigate, Using features like Perfmon, can give us more details to troubleshoot, Ultimately it has to be fixed from dev, networks and operations end
At times the fix may be to increase or upgrade the infrastructure,
If you want can read on Performance Engineering
Hi Raghav, i found this error while executing, kindly guide me......
Thread Name:Thread Group 1-1
Sample Start:2020-06-16 11:13:53 PKT
Load time:2
Connect Time:0
Latency:2
Size in bytes:1544
Sent bytes:119
Headers size in bytes:738
Body size in bytes:806
Sample Count:1
Error Count:1
Data type ("text"|"bin"|""):text
Response code:403
Response message:Forbidden
HTTPSampleResult fields:
ContentType: text/html;charset=utf-8
DataEncoding: utf-8
Hi Arbaz, 403 Forbidden error means that you do not have permission to view the requested file or resource. Pls check your user and privileges. Hope you have provided the authentication credentials
Inside the Server Agent it is showing me, SH File, not the Shell script, file startAgent.sh
Hi Sonu, what is the sh file you are referring here.
@@RaghavPal
when I have extracted that Server agent folder, here instead of Shell script file type, I can see SH File, and it is opening as Notepad file.
@@RaghavPal hello Raghav, any solution
file with extension .sh is executable, will need to check more online
HI Raghav, can you please tell me that is it the same way to check performance if autoscaling is ON. if not please suggest how to do it?
Neha
When using JMeter with PerfMon (Performance Monitor), you can monitor server performance even if autoscaling is enabled. Here's how you can do it:
1. Integrate PerfMon with JMeter:
- First, ensure you have the PerfMon Metrics Collector plugin installed in JMeter.
- Next, configure the PerfMon Metrics Collector listener in your JMeter test plan.
- Specify the hostname or IP address of the server where you want to monitor performance.
2. Server Agent and Metrics Collector:
- Leverage the Server Agent and PerfMon Metrics Collector to monitor the performance of your hosts.
- This setup helps you identify bottlenecks and validate health metrics.
- The PerfMon Metrics Collector collects data from the server agent and displays it in JMeter.
3. Non-GUI Mode:
- If you're running JMeter in non-GUI mode (e.g., for load testing), you can still use PerfMon.
- Add a JTL file to the PerfMon Metrics listener. Ensure that this file has a different name than your JTL file specified in the non-GUI command line.
- The PerfMon Metrics listener will log data when run in non-GUI mode
Remember to adjust your PerfMon configuration based on your specific server setup and requirements.
-
@@RaghavPal Thank you so much Raghav, I will try this solution, thanks a lot.
Hi Sir,
I have followed the above steps and got the results. Now, I want to get the stats of the DB server while running my load test. In this case, my DB is running on a different server and my application is running on a different server and there is a 3rd server(client machine) on which my JMeter is running.
How to run load test in this case when a separate DB server is running.
Thanks and looking forward.
Hi, one of the ways to check is you can check your DB logs and monitoring services during the time of the performance test run
Hi Raghav,
Thanks for this session. I have one query how would you analyse your server health if it is hosted in cloud like AWS or Azure.
please advise
Hi Swarna, you just need to provide the values to connect to your server. And the required ports and connectivity parameters must be set. In simple words the JMeter machine should be able to connect to your server machine and you can take your networks team help if needed
@@RaghavPal thanks Raghav..
Is it mandatory to have latest Java version to open the StartAgent.bat? because I have java jdk 8 and my StartAgent.bat file just opens for 2-3 sec and immediately closes.
I will check, you can try and post your findings here
Hi Raghav, Thanks for putting video on this. I am able to capture server stats in jmeter. Only concern I am have is that how will I know aggregate cpu utilization figure. As in perfmonitor application, in summary report, we get overall CPU utilization number. But here in jmeter we get only chart. Its bit difficult to determine overall CPU utilization. Is there any method to calculate overall CPU utilization time from Jmeter chart.
How to configure the performance test on a different server, which is not hosted on my machine? Thanks you :)
Hi, you just need to provide your server details as shown in this video
thanks for your answer but I only worked locally but not to another server because the port is different, how could the port change?
You should be able to connect to the server from your system. so you just need to get the details (ip, url etc) You can take help of your network team on that
hey Raghav. thanks much for these wonderful videos. I am having an issue where the connection is set up and the test commands are received by the Start agent through telnet in 4444. but when I run and validate the perfmon metrics collector listener the connection just drops and I get the message the host is disconnected. Starting measures : cpu: .... then client disconnected. couldn't figure out
Hi Sangeeth, not sure, may be some network connection issue between the 2 systems. Are you behind proxy for corporate vpn. May be your network team can help here.
Hi Sir,
I followed the steps and able to check client can talk to server via port 4444. Question is, my perfmon listener does not display anything in the chart when I start running the test, eventhough I've increase the total thread user number to 10 already. Can advise what is the issue here?
Also need u to clarify, is the serveragent always automatically shut down after running the test on jmeter? I noticed everytime i want to start re-run the test, I need to restart the agent again. Hope to hear from you. Thanks
Hi Anis, do you get the final result, not sure why it not show result in the beginning, Can be some network latency. Can check this stackoverflow.com/questions/63593126/jmeter-server-agent-is-getting-stopped-as-soon-as-i-am-running-the-jmeter-scrip
Thank you very much for the video
I tried to do the exercise, but at the time of running the test does not paint the graphics, the message "Waiting for samples..." always appears. I made a request with the 'telnet' command and the server answered without problems. The JAVA_HOME I have it configured. The view results Tree makes the requests correctly.
What do you think could be the problem?
Hi Alma, pls check if you are running a very small test with very less user load. You can iterate with some good amount of load (threads) so that it generates some load on the server and we get data. Also, check the log section. Click the warning button at top right to check if there are any issues
Hi Raghav, Here why we have added 9191 as port ?
Hi Ravina, I believe you are talking about jenkins, You can start on any port and if you do not give any port no. it will start on default port i.e. 8080 if available
How can I know more detail information about the metric parameter? for example, when I add CPU Metrics, there are so many Parameter such as Primary Metrics, Additional Metrics. ...
It depends on what all metrics you want to check. Your network or operations teams can help
Hi Raghav,
Thanks for the video. Do you know any practice to assert the collected metrics? So let's say if the memory usage is above 60% the test must fail or if CPU usage is above 80% for 2 minutes it must fail.
Thanks in advance.
Hi Mihály,
I am not sure if there are any separate assertions that we can put in JMeter. You can check more here www.blazemeter.com/blog/how-monitor-your-server-health-performance-during-jmeter-load-test
@@RaghavPal Thank you very much for the very quick answer.
I wish you all the best.
While getting the plugin manager in JMeter after restarting I am seeing an error called "Failed to load plugin manager". Please help me how to resolve it
Hi, try to add plugin manager (diff ver) again and restart JMeter
Hi Ragav, i gone through with the video but when i run telnet command it is saying telent is not an internal or external command. i have given serer name and port number in perfmon plugin also i am getting error as agent is unreachable via TCP can you please suggest on this.
Hi Kiran, pls check if this helps - stackoverflow.com/questions/25031090/telnet-is-not-recognized-as-internal-or-external-command
Hi Ragav,
I have been trying to install the server agent in my local machine and trying to capture the server metrics during the load test which is executed in Jmeter but the thing is when i start my jmeter script in my local machine the server agent is crashed or closed automatically and getting error log in server agent installed folder so that i could not able to monitor the server metrics like cpu and memory in Jmeter perfmon metrics collector | pls do help me to solve this issue
Hi Prasanth, did you check the logs, What do they say
@@RaghavPal yes, im getting this below messages
# A fatal error has been detected by the Java Runtime Environment:
#
# EXCEPTION_ACCESS_VIOLATION (0xc0000005) at pc=0x0000000010014ed4, pid=15712, tid=0x00000000000021dc
#
# JRE version: Java(TM) SE Runtime Environment (8.0_261-b12) (build 1.8.0_261-b12)
# Java VM: Java HotSpot(TM) 64-Bit Server VM (25.261-b12 mixed mode windows-amd64 compressed oops)
# Problematic frame:
# C [sigar-amd64-winnt.dll+0x14ed4]
#
# Failed to write core dump. Minidumps are not enabled by default on client versions of Windows
Pls check what is your java ver and if java is properly installed with env variables set
Java on Windows - ua-cam.com/video/FqpmH8MVO6A/v-deo.html
Java on Mac - ua-cam.com/video/NSvtis2fGlA/v-deo.html
Hi @@RaghavPal,
I found the same error as Prasanth and I have installed java then set the environment variable according to the tutorial above and when I exucute again in Jmeter, I still find the same error.
please do help me to solve this issue, thanks
Hi Raghav, I am facing issue with connecting performon with Jmeter , can you please help me on this?
Hardik
Please send me the details with all that you have tried
How you collect the Linux server metrics?
For Windows server we use perfmon what about Linux server
Please explain
Hi Chandrabhusan,
Can check this discussion stackoverflow.com/questions/345543/perfmon-like-for-linux
Many Thanks Raghav, this was amazing tutorials,.Can we get this perfmon graphs in HTML reports. Please suggest . Thanks in advance
Hi Nagesh, have not tried this. Can check online. This may help to run perfmon from cmd stackoverflow.com/questions/56970792/perfmon-reports-in-jmeter-using-non-gui-mode
I am getting this error - 17:13:41 - ERROR: java.io.IOException: Agent is unreachable via TCP
Hi Priyank, check & try some options here - stackoverflow.com/questions/51135728/getting-this-error-error-java-io-ioexception-agent-is-unreachable-via-tcp-jp
how can i check through mack if the client can talk to server?
I will need to check online for that.
Hello, sorry I have a problem again. When I want to Apply changes and download I can't finish because the http2-client is failed to download. I have the message "failed to apply changes: Failed to download library http2-client".
Hi Stefan, lets try the new http/2 plugin www.blazemeter.com/blog/the-new-http2-plugin-for-jmeter-the-complete-guide
Sir, Is there any way to add the perfmon's results to HTML dashboard
Not tried it, and I think there is no direct way or plugin to do that, stackoverflow.com/questions/69250690/how-to-see-perfmon-graphs-in-html-dashboard-results-in-jmeter
Thank you very much. I would like to know if this is the same as JMeterPerformanceLibrary?
Hi Cebisile, I have not checked on this, You can send me its url to check
Hi Raghav , If I have 4 linux EC2 instances of my environment , so do I need to add the Server Agent on all 4 servers or only on one server?
Hi Swapnil, in case you have load balancing setup, then can use a single master server, Else will need on all
It says telnet is not regcognized as internal or external command. what should i do ? please help
Nishant
For the "telnet is not recognized as internal or external command" error in JMeter PerfMon, Here are consolidated steps and insights to resolve this issue:
1. Verify Telnet Client Installation:
- Windows:
- Check if the Telnet Client feature is enabled. Go to Control Panel > Programs and Features > Turn Windows features on or off. Find and enable "Telnet Client".
- If it's not available, you can download and install Telnet from Microsoft for Windows 10 or 11.
- macOS/Linux:
- Telnet is typically pre-installed on Unix-based systems. Open a terminal and type `telnet` to see if it's available. If not, install it using your package manager (e.g., `sudo apt install telnet` or `sudo yum install telnet`).
2. Check JMeter Configuration:
- Properties File:
- Open the `jmeter.properties` file (usually in the JMeter `bin` directory).
- Locate the `server_port` property and ensure it's set to the correct port number used by your PerfMon server (commonly 4444, but check your configuration).
- Double-check for typos or mismatches.
- Advanced Settings:
- In JMeter, go to Edit > Options > JMeter Plugins.
- Make sure the PerfMon plugin is enabled.
- In the main JMeter window, right-click on the Test Plan and select "Add Listener" > "JP_TCP Listener".
- Configure the "Host" and "Port" to match your PerfMon server settings.
3. Firewall and Connectivity:
- Confirm Accessibility:
- Use a tool like `telnet your_server_ip port_number` (replace with your actual values) to test direct Telnet connectivity from your JMeter machine to the PerfMon server. This helps rule out network or firewall issues.
- Firewall Rules:
- If necessary, create or adjust firewall rules on both machines to allow incoming and outgoing connections on the port used by PerfMon (typically 4444).
4. Alternative Communication Methods:
- JMeter Plugin Manager:
- Consider using the "JP_UDP Listener" plugin if Telnet communication remains problematic.
- Configure the plugin based on your PerfMon server's UDP settings.
- PerfMon Configuration:
- If your PerfMon server supports other communication methods (e.g., REST API), explore if JMeter has plugins or mechanisms to utilize them.
..
Hi Ragav, am not able to open the server agent batch file in my windows system, could you plz help me on this
Hi Shaik, what is the issue
Hi Shaik, pls check this stackoverflow.com/questions/29769227/serveragent-file-not-running-during-jmeter-cpu-utilization
groups.google.com/g/jmeter-plugins/c/8L2qz02E2Rg/m/D24Top8sAQAJ
Hi @Raghav, can you help me i am always getting waiting for samples, although i run for 100 User.
server cmd also get close after 5 mintutes automatically
can be a performance issue, can also be if your client infrastructure or server is not able to handle a heavy load
Thanks Raghav, can you please suggest how to add perfmon graphs in APDEX report when running jmeter via non gui mode, would be great help...
Hi Deepak, I will check and plan a session on this
sir i need one help i have done all the things what u have told but in our web application we want to use URL to server performance we cant give war file so please help me from this
I will check on this Danish
@@RaghavPal thanks for ur reply please show as soon as possible thanku
@@RaghavPal whats the status sir
I will need to do hands-on to check this, I will do a session
Hii sir I am getting telnet is not recognised internal or external command can u pla help me
Hi Poornima,
This error generally means that the Telnet client is not installed on your system or is not properly configured
PerfMon Plugin uses the Telnet client to connect to the PerfMon Server Agent, which runs on the system you want to monitor. If the Telnet client is not installed or is not properly configured, the plugin will not be able to connect to the server agent and you will see the "telnet is not recognized" error message.
*Follow these steps*
1. Check if the Telnet client is already installed on your system. In Windows, you can check for the Telnet client by going to Start > Control Panel > Programs > Programs and Features. If the Telnet client is listed, it is already installed. If it is not listed, you will need to install it
2. If the Telnet client is not installed, you can install it by following these steps:
Go to Start > Control Panel > Programs > Turn Windows features on or off.
Scroll down the list of features and check the box next to Telnet Client.
Click OK to install the Telnet client.
3. Once the Telnet client is installed, you will need to make sure it is properly configured. To do this, you can follow these steps:
Go to Start > Control Panel > System and Security > System.
Click the Advanced system settings link on the left side of the window.
Click the Environment Variables button.
Under the System variables section, scroll down and find the Path variable.
Click the Edit button.
Add the path to the Telnet client to the end of the Variable value field. The path will typically be "C:\Windows\System32" (without the quotes).
Click OK to save the changes.
Let me know if this works
Any source to learn performance center ? If, then pls share link. Thanx
Hi Abhishek, not yet created
Hi sir we have multiple counters are available in performon how to add those counters ,please let me know
Hi Sireesha, I did not get your scenario. Pls provide details
Hi Raghav, how can we analyze perFmon metrics collector graph or csv , please provide some information.
I will do a session on this
Thank you very much Raghva! Can you pls let me know how to configure jmeter-prometheus-plugin in jmeter and use it for monitoring results in grafana dashboard? Here my database should be prometheus. Kindly help me here. I am unable to configure prometheu listener to prometheus database in jmeter.
Hi Rayala, I have not used or worked on this. Will have to check online
Ok...Thank you Raghav. But if you help me in configuration part, It would be very helpful for me.
I will have to see this topic myself first
How can you generate png report on cpu, memory from cli OR even better how to add cpu usage in standard html report. Thank you.
Can check this - stackoverflow.com/questions/56970792/perfmon-reports-in-jmeter-using-non-gui-mode
@@RaghavPal Thank you 👌
Thanks Raghav. I'm facing error "connection timed out:connect" while executing script using different port.
Please let me know which steps I need to follow to use port other than 4444
Moreover, port which I am using is open ( not restricted in firewall)
Hi Vidula, pls check if this helps you stackoverflow.com/questions/36311394/jmeter-perfmon-plugin-error-java-net-connectexception-connection-timed-out-co
javascript.develop-bugs.com/article/14636815/Jmeter+perfMon+plugin+ERROR%3A+java.net.ConnectException%3A+Connection+timed+out%3A+connect
groups.google.com/forum/#!topic/jmeter-plugins/dHzqXmTNnzQ
Nice videos helped me to get very good knowledge. Can you please upload the video for how to handle drop down functionality using JMeter performance testing.
I have one Scenario, can you please help me out.
In my application, having only one drop down field in one web page. When we select anyone drop down option , data will load. Here the important thing is, each option in drop down list is one Json POST Request. Here Web Url is won't change, even select any drop down option.
Hi Srikanth, here you can test with the actual Json request.
Hello Raghav
can you please talk about heap configuration in jmeter, load generator concept here in jmeter , how would we validate enough load is coming from source traffic to server , please don't leave us in the middle of the something
Hi Agni, the load is what we configure in our JMeter test, where we put the required samplers and use the required threads. And for checking the impact on server from this load, we can use Perfmon, Hope you have seen other jmeter videos
automationstepbystep.com/909-2/online-courses/
Pls let me know if there is anything else that I missed in your query
Hi Raghav,
'How to do performance testing of E-commerce website which is already in Production!?' one of my client complaints that website is very slow and now he wanted to do performance test!
Hi Malay, you have to be very careful if you do any performance testing on production env. Ideally I will not suggest for that. You can talk to your client and ask access to some test env. Here are some points to consider.
1. Always do performance testing on a separate env. Create a sep env which will not be used for other activities
2. Run your tests with the same infrastructure, network stats etc. To get consistent results and can be compared with the baseline
3. Always have a baseline to compare your test against.
4. JMeter checks the server performance and does not care for browser render time. So if you see your jmeter results are good but your application is still slow. Check for client-side performance testing tools
5. Focus on the areas that needs performance testing based on user scenario
6. Always document your results
Thank you for your valuable reply Raghav.
Hello Raghav , thaks to you tutorial i can test my server and monitor its performance
but im recently getting an error like this :
A fatal error has been detected by the Java Runtime Environment:
#
# EXCEPTION_ACCESS_VIOLATION (0xc0000005) at pc=0x0000000010014ed4, pid=6132, tid=46304
#
can you help me ? thanks raghav
Hi Evan,
Have you checked with a diff java version. Pls check this answers.microsoft.com/en-us/windows/forum/all/a-fatal-error-has-been-detected-by-the-java/46631cf2-3053-453c-b8c7-0b2ede7a3eb7
What is the same tool for linux based servers?
Should be able to use Perfmon on linux too
Raghav i can establish the connection but when i run my test plan, i see following error on the bash .
Uncaught Exception java.lang.NoSuchMethodError: org.apache.jmeter.samplers.SampleSaveConfiguration.setFormatter(Ljava/text/DateFormat;)V. See log file for details.
Hi, May be because you are using a version of Perfmon plugin which is incompatible with Apache JMeter version. Either update jmeter-plugins perfmon plugin or downgrade your jmeter
stackoverflow.com/questions/46485264/jmeter-throws-java-lang-nosuchmethoderror-org-apache-jmeter-samplers-samplesave
how i can see perfmon graph in jenkins please guide me@raghav pal
Hi Sadaf, I have not tried, but got some online links to help.
groups.google.com/forum/#!topic/jmeter-plugins/adXuPLIo9K8
jenkins-ci.361315.n4.nabble.com/How-to-view-Jmeter-Perfmon-metrics-collector-graph-via-Jenkins-dashboard-td4745298.html
What in case if the application is behind load balancer. I have 3 application server running behind Laod balancer.
Even in that case, it will be a good test to check if your application will work properly with the expected user load and the load balancers are working efficiently
Hi Raghav,
When I am using the telnet command in my command prompt,I am getting below error
"'telnet is not recognized as an internal or external command,
operable program or batch file."
Please Help
Hi Aditya, I hope you are on windows OS
You have to go to Control Panel>Programs>Turn Windows features on or off. Then, check "Telnet Client" and save the changes. You might have to wait about a few minutes before the change could take effect.
stackoverflow.com/questions/25031090/telnet-is-not-recognized-as-internal-or-external-command
@@RaghavPal Hi Raghav,
The above solution works, but now facing another issue:
In View results tree, in response message i'm getting error as " Forbidden"
In sampler, IP=localhost & Port:9191
jenkins is also running
Please help in this
Will have to check this online, may be specific to the server you are testing
@@RaghavPal No specific server, Followed same steps as yours.
@@adityalokare3902 Even i am stuck in the same place. You got any solution to this ?
Hi Raghav, can you explain about the purpose of port
Hi Pavani, Port is like a communication endpoint over a network
A port number is always associated with an IP address of a host and the type of transport protocol used for communication. Read more here - en.wikipedia.org/wiki/Port_(computer_networking)
Raghav, Can you please post more videos on Monitoring tools like Appdynamics, Dynatrace etc. So that it will be very helpful to us.your way of teaching is very understandable
I will do Pavani
Hi Raghav,
While running the test, I am getting the following error:
INFO k.a.j.p.PerfMonCollector: Can't connect TCP transport for host: localhost/127.0.0.1:4444
Can you plz help me to overcome this.
Hi Anil, not sure if you resolved it by now. If you look at the complete log do you find any missing plugin or lib information? Also you can check this google group -groups.google.com/forum/#!msg/jmeter-plugins/PinO-RdZo_c/XaDuSkltYNkJ
Hi Raghav,
Is there any possibility to display CPU utilization in HTML report.
Thanks,
Hi, Not sure, You can check 14.2 Configuring Dashboard Generation here jmeter.apache.org/usermanual/generating-dashboard.html
How to install perfmon on server if it's scalable ?
I will need to check on this Abdelaziz, can check some online resources for now
@@RaghavPal I think we will need to install it on all the server machines like dynatrace
ok, can check some examples online
This is very helpful.
However, If you have any template format for Load Testing Reporting.
Could you please share it with me?
Hi Vishal, there are some inbuilt templates in jmeter ua-cam.com/video/V0cSlGpi-mA/v-deo.html
My client asking for server performance report. So How to setup with my current project to know about my server performance? Please anyone help me
Hi Deepak, these 2 links can help
www.blazemeter.com/blog/jmeter-performance-metrics
www.vinsguru.com/jmeter-server-performance-metrics-collector/
Hi Raghav, thanks for the video ...could you please upload for jmxmon plugin as well , it would be very helpful.
I will plan Mohsin
@@RaghavPal Thank you i will follow this trail.
Hi Raghav My project source code in my local machine only , now how can i add server jar file in my project
I will need to know the complete process. You can give a try though
When i run my load test using perfmon, this message appears and I lose the connection:
# A fatal error has been detected by the Java Runtime Environment:
#
# EXCEPTION_ACCESS_VIOLATION (0xc0000005) at pc=0x0000000000d14ed4, pid=26616, tid=0x0000000000005898
#
# JRE version: Java(TM) SE Runtime Environment (8.0_271-b09) (build 1.8.0_271-b09)
# Java VM: Java HotSpot(TM) 64-Bit Server VM (25.271-b09 mixed mode windows-amd64 compressed oops)
# Problematic frame:
# C [sigar-amd64-winnt.dll+0x14ed4]
How can I resolve this?
Hi Susy, this can help stackoverflow.com/questions/59528198/jmeter-perfmon-exception-access-violation
Hwllo Raghav, thaks for your efforts, please let me know how to do that in non-GUI mode
Hi Salma, this will help - stackoverflow.com/questions/56970792/perfmon-reports-in-jmeter-using-non-gui-mode
Hello Raghav please add Xpath value extractor and pass the value to next API
For Example: Shopping API, Booking API, Report API
Sure Praveen, I will do.
What is the server is Linux based ?
The steps will be the same Abrar. Can explore more on this online.
Hi Raghav,
Thanks a lot for your videos.
can you please help me with the usage of Jenkins.
Thanks,
Rajitha
Hi Rajitha, you can check this video
ua-cam.com/video/mYGQPj78YhI/v-deo.html
Can also check Jenkins Playlist
ua-cam.com/play/PLhW3qG5bs-L_ZCOA4zNPSoGbnVQ-rp_dG.html
p.p1 {margin: 0.0px 0.0px 0.0px 0.0px; font: 12.0px 'Helvetica Neue'; color: #454545}
p.p2 {margin: 0.0px 0.0px 0.0px 0.0px; font: 12.0px 'Helvetica Neue'; color: #e4af0a}
My website hosted in CTRLS Server how to test server
You should be able to use Perfmon, can check more examples online
Hello Sir,
I have followed the above steps but getting this error, I have tried multiple solutions but it didn't work, Please guide me on this:
Response code:400
Response message: Header Folding
Hi, pls check if you have added any headers or any value missing in header manager. Pls check stackoverflow.com/questions/45053274/response-code-400-response-message-bad-request-apache-jmeter
what was the use of jenkins here?
Hi Pawan, part section of this video are you referring to?
There is no use of Jenkins for this video/session.
how to monitor it in Non GUI mode
Hi Jayesh, this can help - ua-cam.com/video/cJT1EXR_Tfk/v-deo.html
jog4j2 error, how do I fix it
Hi Thành, I will need to see the error details or logs to troubleshoot
@@RaghavPal i fixed it,
i have put start-agent in lib, it should be in bin. Thank you!
java 10 version is not supporting jenkins
Hi Gourab , what is the error you are facing.
@@RaghavPal some error is coming...pls share it WhatsApp or mail id so that Ami share korte pari screenshot
Hi Gourab, check this - jenkins.io/doc/administration/requirements/java/
Awesome tutorial Raghav.. Could you please help me in resolving my error.
After downloading jenkins war file, When I type java -jar jenkins --httpport=9191.
I am getting illegal argument exception: unrecognized option: --http
Hi the argument is --httpPort
Check P is in upper case
'telnet' is not recognized as an internal or external command,
operable program or batch file.can u help me for this?
which os are you using
windows sir
Check this - kb.ctera.com/article/how-to-open-a-telnet-session-on-windows-7-or-windows-8-os-16.html
@@RaghavPal www.technipages.com/windows-10-enable-telnet
Go to control panel > Programs and features > Turn window features on or off > Check Telnet Client checkbox and click OK.
Check for connection again
i have a problema ERROR 2023-08-10 15:24:17.091 [kg.apc.p] (): Error getting metric
org.hyperic.sigar.SigarException: java.lang.UnsatisfiedLinkError: 'void org.hyperic.sigar.Cpu.gather(org.hyperic.sigar.Sigar)'
Mundo
The error message "org.hyperic.sigar.SigarException: java.lang.UnsatisfiedLinkError: 'void org.hyperic.sigar.Cpu.gather(org.hyperic.sigar.Sigar)'" indicates that the Sigar library is not able to load the necessary native libraries. This can happen if the Sigar library is not installed correctly or if the necessary native libraries are not available.
To fix this error, you can try the following:
1. Make sure that the Sigar library is installed correctly. You can download the Sigar library from the Sigar website.
2. Make sure that the necessary native libraries are available. The native libraries for Sigar are platform-specific. You can find the native libraries for your platform on the Sigar website.
3. If you are using a virtual machine, make sure that the virtual machine has access to the necessary native libraries. You can do this by mounting the directory where the native libraries are located in the virtual machine's filesystem.
If you have tried all of these steps and the error is still occurring, you may need to contact the Sigar support team for help.
Here are some additional tips to help you avoid this issue in the future:
* Make sure that you are using the latest version of the Sigar library.
* Keep your operating system up to date.
* Use a virtual machine that is compatible with the Sigar library.
* Contact the Sigar support team if you have any questions.
Hi sir, Thanks for the Video. I am unable to start Perfmon server, I am getting "ERROR: java.lang.NoClassDefFoundError: org/slf4j/LoggerFactory", can u give me a solution to solve this.
Hi Ramu, you can check this link stackoverflow.com/questions/68174140/startagent-2-2-3-isnt-staring-for-server-monitoring-in-jmeter
Here there is no best answer, but some links and information that you can try out
Also you can try to do the setup again and check
@@RaghavPal This worked for me. I was facing the same issue as above and I placed the zip folder in C drive and unzipped it in C drive itself and then opened the bat file.
Hi Raghav,
I am getting the below error while running Perfmon on my local machine -
PerfMonCollector: Can't connect TCP transport for host: localhost/127.0.0.1:4444
Can you please help?
Hi Pratim, can you try diff port and check
u mean something instead of 4444?
Yes like 9090, 9191, etc