I watched your videos to help through a data analytics degree and I'm now working in a job type similar to business analyst and looking back at these videos. Very easy to follow, punctual, and informative for getting the job done. Thank you
Take a bow sir! For the first time, I had full clarity on Decision Tree and it's usage! Thanks a lot for this superb tutorial, lucky to find your channel, stay blessed! 👌👍🙏
hello sir, your way of explaining is so simple and effective. made topic simple. i would like to add comment for all as well that i was getting error while using controls=ctree_control and after doing google and forum support , now i am able to run. and veiw tree. Great work sir.
Hello Dr. Rai, thank you for a very informative video. One thing that I would like to add based on my limited knowledge: For a skewed class distribution such as in the data, it is more importance that the model is able to predict the abnormal cases then it is to predict normal cases. If we just look at the mis-classification error, then the model may be aligned towards the class with higher percentage of data. One way to avoid that is to reduce the disparity between the class types by over/under sampling techniques. Another way is to use the Area under the precision-recall curve as a measure of model evaluation. Your comments and feedback on this would be appreciated.
Thank you again for these complete episodes. You have been of a great help to me "Rai". Please, I'd appreciate a complete episode on the ensembles, essentially, heterogeneous ensemble using DT, SVM etc. inclusive as the base classifiers. Comprehensive videos on ensembles are not common, in fact, I haven't come across any. It will go a long way If you could put something together on this. Thank you for your help!
Thank you Professor Rai for taking the time to show us the ropes. Regarding the mis-classification error table, may I know: what is the difference between that and the Confusion Matrix. I notice the calculation for "accuracy" is the same as the Confusion Matrix, simply "sum(diag(tab))/sum(tab)", but for Confusion Matrix, the Actual is on the vertical versus what you stated in video for Actuals in the horizontal. Thanks, and looking forward to more videos from you
Hi Sir, I am so glad to see your all videos on related to machine learning in R, So request one thing if you share your datasets which you have used in your session that will be great
Sir, it'd be really nice if you can make a blog explaining the output in more details. For instance, an explanation of the statistical parameters measured in the confusion matrix. Your videos are really helpful! :)
Thanks for your comments and suggestion! You may find decision tree related explanations in following video too: ua-cam.com/video/J2a9yV3kl-M/v-deo.html
Sir, Greetings from the US, I have enrolled in the machine learning course through Udemy as well but your explanation super simple and easier to implement. Please do guide me with any book which I can use to practice more of such datasets
Deep learning is the hottest topic currently within machine learning field. To get started with practical examples you can try: www.amazon.com/Advanced-Deep-Learning-designing-improving/dp/1789538777
Hi! thank you for all your videos. I'd just like make a little comment: ctree function implements 'Conditional Inference Tree', not 'Clasification Tree'. In fact, it can develop clasification trees, but the fundamentals are different. Thank you for all the work you are doing! very usefull. Carlos
Sir, I have a few questions: 1. How do you find statistically significant variable after developing a decision tree model with all variables? Ho 2. Suppose all variables in a decision tree is coded as POOR, FAIR, GOOD, then how to find the probabilities of each (POOR, FAIR, GOOD) at non terminal nodes of the tree and also number of sample in each category? I need to show this in my plot. 3. What is the best approach in developing a decision tree model? Developing a model on the training data using K Fold Cross Validation OR Developing a model on training data and then going for cross-validation and pruning process using a function like cv.tree() which allows us to choose the tree with lowest cross validation error rate? Which method is better? 4. How to find out the value of the standardized importance of independent variables using CART in R?
1. P-values on the tree indicate statistical significance. 2. You can find it only at the terminal node. 3. k-fold CV is always better to avoid over-fitting. 4. Higher a variable on the tree, more important it is. For variable importance you can also try this link: ua-cam.com/video/dJclNIN-TPo/v-deo.html
That was awesome but I found that with my dataset I get a completely different decision tree using the rpart package. Without rpart, the tree is what I expected it to be and with rpart - in some ways it's almost opposite. I'm only comparing the two trees with my training data.
I think I know what the problem is - with rpart trees you only get a little "yes" and "no" marker on the root node. In my case "yes" goes to the left of the tree and "no" goes to the right of the tree. If I assume that direction is always the case then things are okay. I do wish that the "yes", "no" little while boxes were printed at every non leaf node so it's very clear which way the path is going. (I wonder if there's an option for that?) Thanks for the great video.
Greetings! I came back to this video after a while as it still seems to be the best one regarding Decision Trees out there. I have a quiestion regarding significance of variables. Do you have a video covering this subject? Any techniques I could apply while working on my Decision Tree? thank you
You can use this link. For tree based methods, it provides variable importance plots to show which variables are important and which ones do not contribute much. ua-cam.com/video/hCLKMiZBTrU/v-deo.html
Thank you Dr Rai. I have a question about the tree pruning. Prior to the pruning some of the trees were able to classify patients as pathological but after pruning( by changing the control functions) none of the trees identify the pathological patients. If we were to specifically identify patients with suspected pathology how can we modify the control functions or the initial formula included in the "ctree()" function?
Hi Sir, Your videos are really helpful.It has really helped me a lot, I have few doubts though.I have just started learning data science so these doubts may be naive. 1) On what basis we decide that we should put this much data into training, validation, and testing respectively? 2)Is there any criteria(such as r-square in regression models, Chi-square for logistic regression) for decision trees so that we can say how good our model is?
1) one may experiment with different partitions such as 50:50, 60:40, 70:30, etc., and see what works best. There is no single partition ratio that will work well in all situations. 2) if your y variable is categorical, mis-classification error is used for model performance assessment.
I am a beginner.. could you help me understand if we can use linear/logistic regression todo the prediction here? I have referred your vehicle example and so got confused if we can use that model here.
How can we export the first tree prediction (View(predict(tree,validate,type="prob"))) into XL? When using a data frame they come out horizontally and unreadable.
You can make changes to settings in 'control' to see what helps to improve the model. In the example, I used only 3 variables just for illustration, but you must start with all variables for a better performance.
Thank you, Dr. Roy for sharing simple and detailed explanation on Decision Tree. My query is can we plot ROC curve for Multiclass Data. (pROC package provides to calculate the AUC but I could not find how to plot ROC graph for multinominal data).
great video, everything explained step by step. I have a question tho. some of my data in the DB file is char and i keep getting an error "data class "character" is not supported". how can i include this data in my experiments?
Hi Dr.Rai. I encountered an error on #Misclassification part. I got the table for using the library(party), but I got "all argument must have the same length" when using the rpart() one. But if I use validate set with the rpart package, the table can be generated.
i followed ur method with a dataset i created...its a simple one but the output is just printing the values of my dataset rather than plotting a tree and predicting...can u help me understand why
how can we validate the accuracy or discriminatory from this model? i believe you can use the model outputs from train and validate to somehow calculate chi-square etc?
Hi SIR , how do we apply test set to predict function where the target var have NA values ? As wen i run the function it says predictor must have 2 levels.
Thanks sir for this interesting video. I am facing a problem. My dependent variable is binary(0,1). When I run predict, the estimated values appear in in decimals despite remove "type". So, misspecification error is close to 1. Could you please suggest how I can get the predicted value as 0/1.
When you have decision trees that are too big, 'pruning' helps to reduce size of the tree by removing those parts that do not help much in correct prediction of the outcome. It helps to avoid over-fitting and improve prediction model accuracy.
Hi, I wanted to ask which is most appropriate software for conducting SEM along with moderation analysis, in case of categorical, nominal (binary and multinomial) and ordinal variables as outcome/dependent/endogenous variables ? P.S:The predictor variables are scale,nominal and ordinal variables. Regards
For this, you will have to build rpart model and then you can prune the tree basis on CP value(by printcp(rpart_model) and we choose cp value minimum to prune tree further )
Hi sir, Thank you for the video, it's very helpful! But I still not understand why your model could not predict the 3 model? If we you all the items could we predict more precisely? Thank you!
Hello! I gave my decision tree 97 different features but the decision tree only picked one of these features to make his decision. Is that normal that it doesn't consider all the features for its decision?
It runs with default setting. By making changes to default settings you may be able to make it include some more. But features that have very little impact on the response are unlikely to be included.
I have a query and i tried to google it but I couldn't find any satisfactory answer against it. The question is what is the difference between ctree and rpart tree?
+Mahum Khan Cree is a function within package called "party" for decision tree. Similarly rpart is a function within a package with the same name "rpart". Both are use for decision tree. I prefer party as it is said to be more accurate. If you search "party vs rpart' you can see many good explanations.
When i try to create the missclassification table, it always gives me an error "all arguments have to be the same". Please what can i do ? I am new to data science
You should always pass the model as the first argumnet in predict function. The second parameter should be a data frame of predictor variables only. You can specify type=”prob” as an extra argument to get probabilities of every factor of y. Either type=”class” directly gives you the class of predicted values. By default type argument is set up differently for every R version.
Dear Sir Thank you for your video. Can you do a tutorial on R where multiple tree base models ( Decision tree , Random Forest, Gradient Boosting, Logistic and etc..) comparing each other on the same chart using ROC to represent the visualization and split them by training vs validate data set? It would be a great help for this type of visualization especially presenting to management. Thank you !
Thanks for comments and suggestion that I'll work on in near future. Meanwhile here is a link where you can quickly get ROC that plots and compares several methods such as decision tree, logistic regression, svm, random forest, etc., on the same ROC plot. ua-cam.com/video/J2a9yV3kl-M/v-deo.html
Thank you Sir. The above youtube tutorial is really good. Looking forward on your awesome tutorial on comparison of multiple classification models comparison in one graph split between Train & validate.
When terminal nodes have very small sample sizes, decision tree model is likely to have over-fitting. Due to small sample sizes, decisions arrived in the terminal node may not be very stable.
Decision tree algorithm will automatically choose the attributes or independent variables depending on the parameters such as minimum sample size for splitting, statistical significance, etc., that you choose.
Thank you for your video. I'd like to know that what do you mean "set.seed(1234)"? why don't use set.seed (2) or .. and do we can use "ifelse" instead of definition "pd"? which way is better?
+Info A set.seed(1234) is just an example, you may use any other number. The idea is to reproduce results which any number can achieve. 'pd' was used for 'partitioning data' and it's just a name, you may use any other name, that will be fine too.
When you develop different trees with different validation data, you can choose the one that has smaller size as well as better accuracy. This way you are able to prune decision tree.
Hello Bharatendra Sir, Can you please guide me how to implement perturbation method in R? Currently I classified data using classification (decision tree). Now I want to perturb data and follow same classification. I am unable to proceed. Can you please upload some videos illustrating how to implement perturbation method using R. its very urgent for me.
Megha, here is the link for perturbation analysis. Note that it can be used for only regression like models. It may not work with decision trees. ua-cam.com/video/Jz97ccAIyj8/v-deo.html
Excuse me, sir. Can you help me? I tried this script into my data. i have 100 observation of 1383 variables. I got the result "Conditional inference tree with 1 terminal nodes" and "Number of observations: 83". However, i can't get the decision trees., i just get the histogram. Can you help me, sir? why it's happen?? Thank you, sir.
Hello sir, I'm implementing the same steps for my own set of data. But I am getting an error in the Misclassification part as "all arguments must have the same length". Will it be ok if you can check my code and let me know where I am going wrong? If it's ok for you then I will send you the code and data.
R Studio doubt : I am building a predictive model with 1 million observations and having 15 variables .i am getting error like -" Can not allocate the vector of 432GB " or " Can not allocate the vector of 3.8 GB " I am using 16GB RAM .my file size is just 140MB . and i closed all the applications in my system .still error remains same . Any suggestions much appreciated..
You can probably take sample for creating model with huge data. The difference between model based on a good sample and all data may not be significant. You can also try faster algorithms such as extreme gradient boosting: ua-cam.com/video/woVTNwRrFHE/v-deo.html
In business application you don't really need any math. It's more about how to correctly apply a method, and do interpretation of results to solve a business problem.


I watched your videos to help through a data analytics degree and I'm now working in a job type similar to business analyst and looking back at these videos. Very easy to follow, punctual, and informative for getting the job done. Thank you
You are welcome and god luck!
Sir, I've been following lot of courses but never found something with so clarity. Thanks for posting these!
Thanks for the feedback!
Thanks Doc, after my 6 hrs class ...you went through all my confusions in just 18:43 mins. Such a worthy job!!!
Thanks for your feedback and comments!
Take a bow sir! For the first time, I had full clarity on Decision Tree and it's usage! Thanks a lot for this superb tutorial, lucky to find your channel, stay blessed! 👌👍🙏
Thanks for comments!
hello sir, your way of explaining is so simple and effective. made topic simple.
i would like to add comment for all as well that i was getting error while using controls=ctree_control and after doing google and forum support , now i am able to run. and veiw tree. Great work sir.
Thanks for the update!
Hi, video posted 4 years ago today has become a saviour for my internal assessment
Thank you 😃
Welcome! You may also find this recent one useful:
ua-cam.com/play/PL34t5iLfZddvGr66DPf-L-sSJ50XNwN3K.html
Hello Dr. Rai, thank you for a very informative video.
One thing that I would like to add based on my limited knowledge:
For a skewed class distribution such as in the data, it is more importance that the model is able to predict the abnormal cases then it is to predict normal cases. If we just look at the mis-classification error, then the model may be aligned towards the class with higher percentage of data. One way to avoid that is to reduce the disparity between the class types by over/under sampling techniques. Another way is to use the Area under the precision-recall curve as a measure of model evaluation.
Your comments and feedback on this would be appreciated.
That's correct. For more details about class imbalance problem, refer to this link:
ua-cam.com/video/Ho2Klvzjegg/v-deo.html
You really made it simple. I have been watching others tutorial, but not anymore. I already subscribed. Thanks a lot.
You are welcome!
Thank you again for these complete episodes. You have been of a great help to me "Rai". Please, I'd appreciate a complete episode on the ensembles, essentially, heterogeneous ensemble using DT, SVM etc. inclusive as the base classifiers.
Comprehensive videos on ensembles are not common, in fact, I haven't come across any. It will go a long way If you could put something together on this. Thank you for your help!
Thanks for the suggestion, I'll do it in near future!
Sounds really great. Looking forward to it. Can't wait!
You are truly remarkable! The way you explain things is very simple to understand.
Thanks for comments!
Sir, so much clarity ...How simple and easy you created ! Thank you .
Thanks for comments!
This is a great example of decision trees. Thank you!
Thanks for comments!
Thank you so much for your videos. I am learning everyday with them. May God bless you
Thanks for comments!
Thank you Professor Rai for taking the time to show us the ropes. Regarding the mis-classification error table, may I know: what is the difference between that and the Confusion Matrix. I notice the calculation for "accuracy" is the same as the Confusion Matrix, simply "sum(diag(tab))/sum(tab)", but for Confusion Matrix, the Actual is on the vertical versus what you stated in video for Actuals in the horizontal. Thanks, and looking forward to more videos from you
Both confusion matrix or mis-classification table are same.
Dr Rai, thanks for your videos. I have them useful in explaining basic machine learning methods. Thank you!
Thanks for comments!
Hi Sir, I am so glad to see your all videos on related to machine learning in R, So request one thing if you share your datasets which you have used in your session that will be great
You can get data file from the link in description area below the video.
wow thank you sir....!!!!sir please make video of entropy splitting creation calculation it is very useful sir
Thanks for the suggestion, I've added it to my list.
Sir, it'd be really nice if you can make a blog explaining the output in more details. For instance, an explanation of the statistical parameters measured in the confusion matrix. Your videos are really helpful! :)
Thanks for your comments and suggestion! You may find decision tree related explanations in following video too:
ua-cam.com/video/J2a9yV3kl-M/v-deo.html
Sir,
Greetings from the US,
I have enrolled in the machine learning course through Udemy as well but your explanation super simple and easier to implement.
Please do guide me with any book which I can use to practice more of such datasets
Deep learning is the hottest topic currently within machine learning field. To get started with practical examples you can try:
www.amazon.com/Advanced-Deep-Learning-designing-improving/dp/1789538777
Hi! thank you for all your videos.
I'd just like make a little comment: ctree function implements 'Conditional Inference Tree', not 'Clasification Tree'. In fact, it can develop clasification trees, but the fundamentals are different.
Thank you for all the work you are doing! very usefull.
Carlos
Thanks for the update!
Sir, I have a few questions:
1. How do you find statistically significant variable after developing a decision tree model with all variables? Ho
2. Suppose all variables in a decision tree is coded as POOR, FAIR, GOOD, then how to find the probabilities of each (POOR, FAIR, GOOD) at non terminal nodes of the tree and also number of sample in each category? I need to show this in my plot.
3. What is the best approach in developing a decision tree model? Developing a model on the training data using K Fold Cross Validation OR Developing a model on training data and then going for cross-validation and pruning process using a function like cv.tree() which allows us to choose the tree with lowest cross validation error rate? Which method is better?
4. How to find out the value of the standardized importance of independent variables using CART in R?
1. P-values on the tree indicate statistical significance.
2. You can find it only at the terminal node.
3. k-fold CV is always better to avoid over-fitting.
4. Higher a variable on the tree, more important it is. For variable importance you can also try this link:
ua-cam.com/video/dJclNIN-TPo/v-deo.html
very very clear and helpful. thanks tons
Thanks for comments!
Your videos are honestly so amazing.
Thanks for comments!
Very informative and easy to understand.Thanks for sharing such an useful video.
Thanks for the feedback!
Really Great Explanation
Thanks for comments!
Also here is a link to more recent one:
ua-cam.com/video/RCdu0z2Vyrw/v-deo.html
Thanks sir for detailed video..
Most welcome!
Hi sir ,
my s.nagaraj adiga your vedios are very simple to listen and it is easy to understand thank you very much .
Thanks for the feedback!
in confusion matrix(tab), the column is predicted data and row-wise actual data
In this video I have used predicted data in row and actual in column for the confusion matrix.
Kindly check it, (table(predict(tree),data$NSP), Then the output will be taken in the following way, column is predicted data and row-wise actual data
Try this, it will make it more clear:
table(Predicted = predict(tree), Actual = data$NSP)
That was awesome but I found that with my dataset I get a completely different decision tree using the rpart package. Without rpart, the tree is what I expected it to be and with rpart - in some ways it's almost opposite. I'm only comparing the two trees with my training data.
I think I know what the problem is - with rpart trees you only get a little "yes" and "no" marker on the root node. In my case "yes" goes to the left of the tree and "no" goes to the right of the tree. If I assume that direction is always the case then things are okay. I do wish that the "yes", "no" little while boxes were printed at every non leaf node so it's very clear which way the path is going. (I wonder if there's an option for that?) Thanks for the great video.
See link below that has more detailed coverage:
ua-cam.com/video/6SMrjEwFiQY/v-deo.html
This video as helped me a lot with my assignment, thank you so much.
that's great!
Your videos are always very easy to follow!!
+Tara Paider thanks for the feedback 👍
Greetings! I came back to this video after a while as it still seems to be the best one regarding Decision Trees out there. I have a quiestion regarding significance of variables. Do you have a video covering this subject? Any techniques I could apply while working on my Decision Tree? thank you
You can use this link. For tree based methods, it provides variable importance plots to show which variables are important and which ones do not contribute much.
ua-cam.com/video/hCLKMiZBTrU/v-deo.html
Is it only useful for numerical data? when all the independent variable are continuous? or it can be used for categorical ones too?
It's useful for both. See this more detailed example:
ua-cam.com/video/6SMrjEwFiQY/v-deo.html
Sir plz can u suggest a good book for beginners in machine learning to have basic knowledge of all statistical tools ??
Thank you Dr Rai. I have a question about the tree pruning. Prior to the pruning some of the trees were able to classify patients as pathological but after pruning( by changing the control functions) none of the trees identify the pathological patients. If we were to specifically identify patients with suspected pathology how can we modify the control functions or the initial formula included in the "ctree()" function?
Sir, if you could create a video for how to calculate gini, KS using R that would be really great
Thanks for the suggestion, I've added this to my list.
Thank you for your help and all your videos. It's help me a lot
Thanks for your comments!
Hi Sir, Your videos are really helpful.It has really helped me a lot, I have few doubts though.I have just started learning data science so these doubts may be naive.
1) On what basis we decide that we should put this much data into training, validation, and testing respectively?
2)Is there any criteria(such as r-square in regression models, Chi-square for logistic regression) for decision trees so that we can say how good our model is?
1) one may experiment with different partitions such as 50:50, 60:40, 70:30, etc., and see what works best. There is no single partition ratio that will work well in all situations.
2) if your y variable is categorical, mis-classification error is used for model performance assessment.
Thank you, sir!!
I am a beginner.. could you help me understand if we can use linear/logistic regression todo the prediction here? I have referred your vehicle example and so got confused if we can use that model here.
Yes, you can use logistic regression as response variable is of factor type. For more see:
ua-cam.com/video/AVx7Wc1CQ7Y/v-deo.html
ctree dont support the dates. I tried the dates converted from posix. Can you please suggest the parameter in ctree that resolved this problem ?
Decision tree is not a good methods to work with dates. For dates you should use time series:
ua-cam.com/play/PL34t5iLfZddt9X6Q6aq0H38gn-_JQ1RjS.html
Sir, please post a video on Regression Splines, Polynomial Regression & Step Functions etc
Thanks for the suggestion, I've added it to my list.
How can we export the first tree prediction (View(predict(tree,validate,type="prob"))) into XL? When using a data frame they come out horizontally and unreadable.
How do you remove ticks on the axes? Or realign the axis labels?
Nice video Bharatendra. One question.. you said that we need to optimize the model.... how to do that ie how to optimize our model! Thanks
You can make changes to settings in 'control' to see what helps to improve the model. In the example, I used only 3 variables just for illustration, but you must start with all variables for a better performance.
thanks :)
Thank you, Dr. Roy for sharing simple and detailed explanation on Decision Tree. My query is can we plot ROC curve for Multiclass Data. (pROC package provides to calculate the AUC but I could not find how to plot ROC graph for multinominal data).
At this time it only does it for binomial situation. You can now find roc curve video here:
ua-cam.com/video/ypO1DPEKYFo/v-deo.html
Nice explanation. thanks.
A comparative analysis on pre/post pruning of model would have completed the tutorial on Decision Tree.
great video, everything explained step by step. I have a question tho. some of my data in the DB file is char and i keep getting an error "data class "character" is not supported". how can i include this data in my experiments?
You change such variables to ‘factor’.
@@bkrai omg thank you. so I can just use data$variableF
yes that should work.
love all your videos...Please keeping uploading
+pradeep paul Thanks for your feedback!
Hi Dr.Rai. I encountered an error on #Misclassification part. I got the table for using the library(party), but I got "all argument must have the same length" when using the rpart() one. But if I use validate set with the rpart package, the table can be generated.
Difficult to say much without looking a the code. But you can review your code again, there may be some typo.
its just for numaric variables? is their another cod to charachter variabls
Change character variables to factor variables before using this.
i followed ur method with a dataset i created...its a simple one but the output is just printing the values of my dataset rather than plotting a tree and predicting...can u help me understand why
Difficult to say much without looking at data and code.
Would this work just as well if some variables were categorical? I.e. written in text but limited options
Thanks for the video
Yes, absolutely
You may also try this link:
ua-cam.com/play/PL34t5iLfZddvGr66DPf-L-sSJ50XNwN3K.html
Thank you, great channel. Subscribed!
Thanks!
Reading /Preparing csv data : 0:32
Decision Tree using rpart Package : 11:22
Thanks!
how can we validate the accuracy or discriminatory from this model?
i believe you can use the model outputs from train and validate to somehow calculate chi-square etc?
You can validate the model built on training data with the help of validate data.
brilliant! thank you Dr
You're most welcome!
Thank you so much for your awesome video. I've learned a lot from it.
Thanks for your feedback!
Thanks for your feedback!
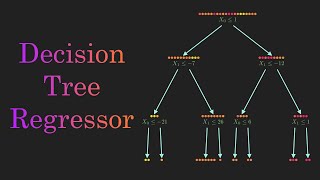
let me ask, top of the variable of the picture is not dependent variable right? 5:46
It's a independent variable.
@@bkrai sir can i ask some simple questions about tree diagram if you do not mind. I leave it here my gmail adress: ogzhnyvzz@gmail.com
You're the man. Keep up the great work!
Hi SIR , how do we apply test set to predict function where the target var have NA values ? As wen i run the function it says predictor must have 2 levels.
You need to impute missing values before developing the model.
like your videos... can you upload some on ensemble and AIC as well. will be very kind of you
Thanks for comments and suggestion, I've added it to my list.
Hi sir nice explanation...learnt about ctree function. Can you please illustrate how we can tune the decision tree model?
Around 7:30 point in the video tuning is shown using "mincriterion" and "minsplit".
Bharatendra Rai my mistake sir...I mean pruning the decision tree
You can do pruning by increasing values for "mincriterion" and "minsplit".
Bharatendra Rai thank u for clarifying sir
Sir how would you increase the number of nodes?
You can change mincriterion and minsplit in the controls part for that.
For a more recent one, see below:
ua-cam.com/play/PL34t5iLfZddvGr66DPf-L-sSJ50XNwN3K.html
Sir why you will give set.seed(1234) why you can't give set.seed(12345).can you pls tell
It can be any number, but to get same samples use the same number next time too.
مفيد جدن
Thanks!
thank you ! so helpful !
Thanks for comments!
Sir what is the difference between rpart() and ctree(). And when to use it??
It's just a different way to represent a tree. Note that both use the same algorithm.
sir, could u make a video on Random forest.
very nice explanation keep it up
thanks for the feedback!
may add more about CHAID trees
Thanks! I'll keep it in mind.
Sir can you provide this dataset which you have used
There is a link below this video.
hello sir....can you plz make a tutorial on how to implement fpgrowth in Rstudio!!! its urgent! plz plz help!
Thanks sir for this interesting video. I am facing a problem. My dependent variable is binary(0,1). When I run predict, the estimated values appear in in decimals despite remove "type". So, misspecification error is close to 1. Could you please suggest how I can get the predicted value as 0/1.
hi sir can u pls explain about pruning of tree. on what basis we do prune ?
When you have decision trees that are too big, 'pruning' helps to reduce size of the tree by removing those parts that do not help much in correct prediction of the outcome. It helps to avoid over-fitting and improve prediction model accuracy.
Amazing, thanks
very helpful thanks
Thanks for comments!
Thanks for comments!
Hi,
I wanted to ask which is most appropriate software for conducting SEM along with moderation analysis, in case of categorical, nominal (binary and multinomial) and ordinal variables as outcome/dependent/endogenous variables ?
P.S:The predictor variables are scale,nominal and ordinal variables.
Regards
Sir,how to choose the Complexity parameter (CP Value)for Tree pruning ?
For this, you will have to build rpart model and then you can prune the tree basis on CP value(by printcp(rpart_model) and we choose cp value minimum to prune tree further )
Hi sir, Thank you for the video, it's very helpful! But I still not understand why your model could not predict the 3 model? If we you all the items could we predict more precisely? Thank you!
That's correct! To obtain the final model we need to include all items and that will improve model performance.
Hello! I gave my decision tree 97 different features but the decision tree only picked one of these features
to make his decision. Is that normal that it doesn't consider all the features for its decision?
It runs with default setting. By making changes to default settings you may be able to make it include some more. But features that have very little impact on the response are unlikely to be included.
It can happen when one of the feature is the close predictor for y. Then that value is quite enough to predict the y alone.
I have a query and i tried to google it but I couldn't find any satisfactory answer against it. The question is what is the difference between ctree and rpart tree?
+Mahum Khan Cree is a function within package called "party" for decision tree. Similarly rpart is a function within a package with the same name "rpart". Both are use for decision tree. I prefer party as it is said to be more accurate. If you search "party vs rpart' you can see many good explanations.
hello sir its great video does the rpart uses gini index?
It uses altered priors method.
When i try to create the missclassification table, it always gives me an error "all arguments have to be the same". Please what can i do ? I am new to data science
I am also getting same error message
You should always pass the model as the first argumnet in predict function. The second parameter should be a data frame of predictor variables only. You can specify type=”prob” as an extra argument to get probabilities of every factor of y. Either type=”class” directly gives you the class of predicted values. By default type argument is set up differently for every R version.
Thanks for the update!
Dear Sir
Thank you for your video. Can you do a tutorial on R where multiple tree base models ( Decision tree , Random Forest, Gradient Boosting, Logistic and etc..) comparing each other on the same chart using ROC to represent the visualization and split them by training vs validate data set? It would be a great help for this type of visualization especially presenting to management. Thank you !
Thanks for comments and suggestion that I'll work on in near future. Meanwhile here is a link where you can quickly get ROC that plots and compares several methods such as decision tree, logistic regression, svm, random forest, etc., on the same ROC plot.
ua-cam.com/video/J2a9yV3kl-M/v-deo.html
Thank you Sir. The above youtube tutorial is really good. Looking forward on your awesome tutorial on comparison of multiple classification models comparison in one graph split between Train & validate.
Thanks!
Could you please explain me this a little bit more?
pd
You can go over this that has more detail:
ua-cam.com/video/aS1O8EiGLdg/v-deo.html
hi, can u provide me the explanation of how over fitting occurs in decision tree?
When terminal nodes have very small sample sizes, decision tree model is likely to have over-fitting. Due to small sample sizes, decisions arrived in the terminal node may not be very stable.
what if there are two target variables like NSP and some other. what deecision tree techniques to use?what will be the formula?
You can make two separate trees.
how we will derive the formula?based on what atributes
Decision tree algorithm will automatically choose the attributes or independent variables depending on the parameters such as minimum sample size for splitting, statistical significance, etc., that you choose.
Thanks a ton!!
+Preeyank Pable 👍👍👍
sir please tell me about classical or crisp decision tree
Sir how can be decision tree can be used for variable selection
Importance of a variable in the tree is reflected by it's position. For example, the one at top of the tree is the most important.
Thank you for your video. I'd like to know that what do you mean "set.seed(1234)"? why don't use set.seed (2) or ..
and do we can use "ifelse" instead of definition "pd"? which way is better?
+Info A set.seed(1234) is just an example, you may use any other number. The idea is to reproduce results which any number can achieve. 'pd' was used for 'partitioning data' and it's just a name, you may use any other name, that will be fine too.
dear sir, how can i get the data set that you are using
your email?
Actually I don't need email. You can get data from:
sites.google.com/site/raibharatendra/home/decision-tree
what does the p value represents??
+divya damodaran A p-value of 0.05 means 95% (1 - 0.05 = 0.95) confidence in concluding the variable to be statistically significant.
okay thankyou..
how cross validation is useful i pruning the tree ??
When you develop different trees with different validation data, you can choose the one that has smaller size as well as better accuracy. This way you are able to prune decision tree.
Hello Bharatendra Sir, Can you please guide me how to implement perturbation method in R?
Currently I classified data using classification (decision tree). Now I want to perturb data and follow same classification. I am unable to proceed. Can you please upload some videos illustrating how to implement perturbation method using R. its very urgent for me.
Megha, here is the link for perturbation analysis. Note that it can be used for only regression like models. It may not work with decision trees.
ua-cam.com/video/Jz97ccAIyj8/v-deo.html
Excuse me, sir. Can you help me? I tried this script into my data. i have 100 observation of 1383 variables. I got the result "Conditional inference tree with 1 terminal nodes" and "Number of observations: 83". However, i can't get the decision trees., i just get the histogram. Can you help me, sir? why it's happen?? Thank you, sir.
+Gebri Adinda you can send data and I can look into it.
@@bkrai , Sir I get the same error , "Conditional inference tree with 1 terminal nodes" only histogram and number of observations=144..can you help?
Can you use categorical variables as predictor? For example, Man/Woman or American/Asian/African
Yes, you use categorical variables as predictors.
Thank you! So i just input them as factors into the model?
That's correct.
How can you plot the tree for the prediction of a new data entry?
Hello sir, I'm implementing the same steps for my own set of data. But I am getting an error in the Misclassification part as "all arguments must have the same length". Will it be ok if you can check my code and let me know where I am going wrong? If it's ok for you then I will send you the code and data.
yes send the code.
Thank you sir. To which email id I should send the code. My email id is subashinivec@gmail.com
sir nice video
i want ID3 and C4.5 implementation using R. please help me with the code
Is there any code for id3 algorithm using r?
R Studio doubt :
I am building a predictive model with 1 million observations and having 15 variables .i am getting error like -" Can not allocate the vector of 432GB "
or " Can not allocate the vector of 3.8 GB "
I am using 16GB RAM .my file size is just 140MB . and i closed all the applications in my system .still error remains same .
Any suggestions much appreciated..
You can probably take sample for creating model with huge data. The difference between model based on a good sample and all data may not be significant. You can also try faster algorithms such as extreme gradient boosting:
ua-cam.com/video/woVTNwRrFHE/v-deo.html
Bharatendra Rai sure sir ,I will try today
Hi sir,how far learning math of the algorithim needed?
In business application you don't really need any math. It's more about how to correctly apply a method, and do interpretation of results to solve a business problem.
Thanks sir for your valuable inputs