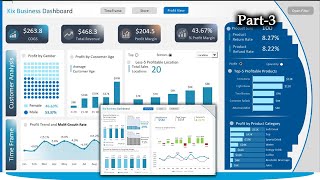
Interactive Insights: Excel Dashboard Techniques. How to create Excel Dashboard.

Вставка
- Опубліковано 25 сер 2024
- #2 Unlock the full potential of Excel with our latest tutorial on 'Interactive Insights: Excel Dashboard Techniques for Real-Time Data'.
Watch part-1 here: • Interactive Insights: ...
Download Dataset here:drive.google.c...
Get full Dashboard here: www.udemy.com/...
✔ If you need me to create your Dashboard send WhatsApp Message to: +234 810 6090 365 Business only.
✔ Follow me on Facebook for more content: www.facebook.c...
✔ Follow me on WhatsApp Channel: whatsapp.com/c...
✔ Our other courses here: pfieuz-schruag...
In this in-depth video, we’ll guide you through the process of transforming raw data into dynamic, real-time dashboards that provide actionable insights at a glance.Dive into advanced Excel features that allow you to create a dashboard that not only tracks key performance indicators (KPIs) but also engages with vivid visualizations tailored to your business needs.
We start by dissecting customer analysis to show you how to display profits by gender and age, offering you the tools to segment your audience and refine your marketing strategies effectively.Then, we take a deep dive into profitability trends. Learn how to utilize Excel's powerful charting and trend analysis features to uncover hidden patterns in your data, revealing insights into sales effectiveness and seasonality that can drive your business decisions.
Our session doesn't stop at static numbers; we introduce interactive elements that make your dashboards responsive and insightful. Understand the nuances of tracking profitability by weekdays and the significance of this data in operational planning and optimization.Additionally, we cover product analysis in a way that highlights not only the top-performing items but also sheds light on return and refund rates-crucial for inventory management and financial forecasting.Join us as we explore techniques to compare store performances and dissect month-by-month sales data for a comprehensive understanding of your financial standing. Plus, get expert tips on presenting this data in a way that’s both understandable and engaging to stakeholders.
By the end of this tutorial, you’ll have a blueprint for building interactive dashboards that bring your Excel data to life, enabling you to make informed decisions swiftly and confidently. So, whether you’re a data analyst, business owner, or Excel enthusiast, get ready to elevate your data game with 'Interactive Insights: Excel Dashboard Techniques for Real-Time Data'!"


Can't wait to tackle this one!!😃
🙏
Hello Ismael 😊, quick question, I thought there was no relationship between the fact table and the target table in the first video? Maybe I am wrong!
@@ismaelkourouma5558 The target table only has relationship with the date table and the sales person table. Not the FactTable.
Very nice job❤ can’t wait to see how you made the filter part mine is awful 😢
Link the target month to the date table you created and the store id to the to sales person id.
You might be missing it there.
when i'm using the slicer, my excel is not responding and it gets closed. also after using zebra bi tables for office, excel is really slow. please help me with this?
That has to do with your RAM or your Excel version. You need spacious RAM to run swift Excel.
@@datalab365 What amount of RAM can be considered good for this to work efficiently? Also what can I do now for this to resolve?
@@pasha9806 core i5 or latest core i7
Watch this: facebook.com/share/r/mCDHv4DKVjNB7Ak7/?mibextid=oFDknk
It will guide you to get a better PC.
RAM minimum 8 GB
@@datalab365 core i5. Thanks for sharing let me go through this.
Also needed to ask that you have total target for every month but in the data provided it was all for January.
@@pasha9806 is for every month. Check your relationships