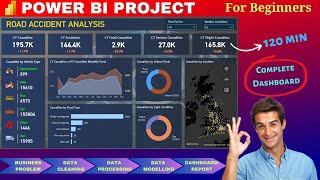
Power BI Dashboard Project | Power BI Tutorial for Beginners 2024 | Power BI Course

Р’СҒСӮавРәР°
- РһРҝСғРұліРәРҫРІР°РҪРҫ 2 лиРҝ 2024
- Power BI Dashboard Project | Power BI Tutorial for Beginners 2024 | Power BI Course
#powerbi #dataanalytics #datascience
Welcome to this comprehensive Data Analyst Project tutorial! In this tutorial, I will guide you through the complete process of building a data analysis project using popular tools such as Power BI, Tableau, SQL, and Excel.
Whether you are a beginner or an experienced data analyst, this tutorial will provide you with the necessary knowledge and hands-on experience to successfully complete a data analysis project. Join me on this journey and unlock the power of these essential data analysis tools.
рҹ“ұData Analyst Materials & Projects - topmate.io/data_tutorials
рҹ“ұFor Important Data Analyst Materials and Other Resources - topmate.io/data_tutorials
рҹ“ұFollow me on LinkedIn - / swapnjeet-s-58a673273
рҹ“ұFollow me on Facebook - profile.php?...
Data Download - drive.google.com/drive/folder...
вӯҗFor Tableau, Power BI and Excel Projects contact me on my mail id or WhatsApp number mentioned at the end of description box.
вһ–вһ–вһ–вһ–вһ–вһ–вһ–вһ–вһ–вһ–вһ–вһ–вһ–
вӯҗContent
00:00 Introduction to Dashboard
07:08 My Website
08:44 Problem Statement
14:25 Software Used
15:27 Data Walkthrough
19:50 Connecting Power BI to Database
22:02 Data Cleaning- Power Query
27:15 Background Design
31:00 KPI's Development
56:00 Chart's Development
01:16:30 Slicers Design
01:22:03 Outro
вһ–вһ–вһ–вһ–вһ–вһ–вһ–вһ–вһ–вһ–вһ–вһ–вһ–
вң…Data Modelling - вҖў Data Modeling in Power...
вң…Data Cleaning - вҖў Data Cleaning in Power...
вң…Data Analyst Portfolio Projects - вҖў SQL & Excel Portfolio ...
вң…Power BI Projects - вҖў Power BI Dashboard fro...
вң…Tableau Projects - вҖў Tableau Dashboard from...
вң…Excel Projects - вҖў Dynamic Excel Dashboar...
вң…SQL Projects - вҖў Data Analysis SQL Proj...
вң…Power BI Interview Questions with Answers - вҖў Power BI Scenario base...
вң…Tableau Interview Questions with Answers - вҖў Tableau Scenario Based...
вһ–вһ–вһ–вһ–вһ–вһ–вһ–вһ–вһ–вһ–вһ–вһ–вһ–
Reach out to me for any personal or Business related Dashboard/ Report development on my email- swapnjeet555@gmail.com
WhatsApp - +91 9579005495
вһ–вһ–вһ–вһ–вһ–вһ–вһ–вһ–вһ–вһ–вһ–вһ–вһ–
Related keywords:
data analyst project,
data analyst project for beginners,
data analyst portfolio project,
data analysis project,
data analyst projects for resume,
data science project,
data analyst portfolio project
data analyst project
data analysis project
data analyst projects for resume
data analyst sql project
end to end project for data analyst
sql project for data analyst
project for beginners
sql portfolio project
data analyst sql project
data analyst full project
data analyst resume project
power bi tutorial ,power bi desktop tutorial ,power bi tutorial for beginners ,power bi desktop ,power bi dashboard ,power bi training ,power bi demo ,power bi for beginners ,power bi dashboard tutorial ,power bi tutorial for beginners excel ,power bi ,tutorial ,desktop ,dashboard ,excel ,microsoft excel ,power bi vs tableau ,tableau vs power bi ,tableau ,mspowerbi ,Power BI Pro ,PowerBIPro ,Avi Singh ,powerbi , Microsoft PowerBI, Microsoft Power BI, PowerBI, Power BI, PowerBI Tutorial, Power BI Tutorial, PowerBI Dashboard, PowerBI Data Visualization, Power BI Data Analytics, Power BI Analysis, PowerBI Report and Dashboard Design, Power BI End to End Tutorial, PowerBI End to End Project, PowerBI Data Modeling, What is PowerBI, How to use PowerBI, Power BI Tutorial for Beginners - Basics and Beyond, Power BI Tutorial for Beginners - Getting Started, Analyze & Visualize Data with Power BI, Mastering Microsoft Power BI - Introduction to Power BI, Power BI Tutorial For Beginners | Introduction to Power BI, Data modelling in Power BI Desktop, Power BI Advanced Tutorial, Power Bi query and dax, Power BI Tutorial Video, PowerBI Report and Dashboard Design, End to End Project- Power BI Dashboard for Beginners - Complete project - 2024, Power BI in Hindi - Power BI Tutorial for Beginners, power bi tutorial in hindi,


Great effort and clear explanation, thanks for the dataset provided.
Very useful presentation, I learnt a lot. Thanks
VERY USEFUL... THANK YOU...
Thank you so much, I am from Bangladesh and l have completed your several tutorials. Please Give us a tutorials how can we share our Report and Dashboard in Power Bi
with client in a real project?
Thank you so much sir. For providing this type of valuable content.
Please also make project videos that covers all the important topics for data analysis in Python & SQL to crack interviews.
Your tutorials are really useful and awesome! Love the fact that you also always have the workbooks available so I can follow along рҹҷҸ
Glad you like them!
nice work done, thanks for giving out to society, few of my desire channel
pls can you do one for multiple dataset as well pls
thanks for always
do more many many projects like this we will share subscribe and comment and share in my groups to reach maximum data analyst enthusiastic wonderful effort ur rocking keep going sir we want in future many beginner and advance level projects including portfolis like power bi+sql+mysql+python+advance sql also i expect these portfolios and as well as tableau combination also tq very much for this channel i appreciate u very much keep it up never stop doing these type of projects...tqq
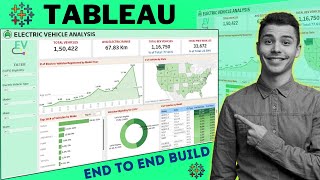
A simple donut chart could have been used to visualize the BEV and other type of vehicles. why to create two different donut charts?
Nice Explanation and Appreciated. I Suggested you based on your explanation, make videos on Complete DAX from Zero to Hero. Thanks
Working on it, its not easy to create a Dax tutorial. It takes lot of time to create scenarios and make audience understand through same. Will be uploaded soon
I made this project and I want to share on your linkedin profile, so please share your link
Is it ok to use Calculate Dax function rather applying a filter to get total vehicle after 2010? at time 35:00
thank you soo much
Sir, the "Total Vehicles by State" map visual isn't working properly. Only one "State" is showing "Total Vehicles", the rest are only showing "State" Name.
hi sir i saw your page you provide mock interview preparation on power bi but i need power bi sql tableau excel python can you please help me
Sir Power BI ka course suggestions de dijiye
Can you make a project by using python or R scripts to create Power BI Dashboard
Can anyone share the Microsoft's website where we can get sample dashboard design
Sir can we post it on LinkedIn after completion done by ourselfsss....
i dont have shape map?
Go to file , option, feature, enable shape maps from there
Sir, I have an issue with the map. It is not showing to me. What should I do? Please tell me.
please go to power bi option click security option and scroll the map and filled map visuals enable