You're a fantastic teacher; the Tableau community is fortunate to have an advocate that is both knowledgeable and able to convey functional topics in a complete and a concise manner. Rock-star extraordinaire.
Bingo! You have hit the bull's eye, with the "bullet" in this Bullet Chart tutorial! Thanks Donabel for yet another comprehensive video covering an important chart type! Waiting for more!
Hello Belle! You are back! Thank you so much for creating such a good channel for us who are just started to learn Tableau! Been learning a lot from your video!
As Always!! Awesome job, and thanks for your efforts. I am hoping that we will see from you some tutorials about Gauge Chart and Radial Chart, I know there are several videos but the way that you are presenting is really simple with less confusion 🙂
This channel is really useful. Thank you. I noticed that the database from tableau public has been modified and I'm unable to replicate the viz. It seems that the year = year[Gift Date] relation it's not working and I'm getting all the year values as null. Is there any solution for that, or I'm just doing it wrong? If I change the referential integrity the null year disappear, but there is no data in the bars.
How did you edit the date in the data source? When I change the number format the date visually changes but the date is still in mm/dd/yyyy in the formula bar for those cells so when I transfer it to tableau it's still in that format and all the years become null in the worksheet.
I have a general question. How many years tableau sustain in a Indian software industry. Some of my friends saying.. tableau scope is decreasing now. Please suggest me what to lean in data visualization.
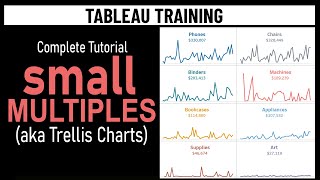
Thanks, nice work! One question: how did you add horizontal whitespace between the row bands? Are those just thick white row grid lines? I did that but even the thickest lines result in less spacing than I'd like to have... Also one remark: the downloadable .twbx uses different row banding (50/80/100) than what you propose in this video (50/75/100).
Thank you, mam, you solve every business case scenario... Mam, I have one request how much SQL & ETL (Tableau Prep) is needed for the data analyst to cover because in the corporate company this is the major requirement. Can you create one video for this, or create playlist for SQL. As a new in this field, this will help many newbies like me. Please reply mam.
Take my advice with a pinch of salt; I've been a full-time Tableau developer in Germany for 5 years. In Tableau jobs, you rarely need raw SQL (e.g., SELECT FROM ...). Raw SQL is overrated, in my view. However, you need to understand databases (joins, referential integrity, partion, granularity...). In short, lean the basics of raw SQL and do learn as much Tableau as you can (Tableau Prep, Tableau Desktop, & Tableau Server [not admin, but publishing, architecture, publishing data sources, Prep Conductor...]). Good luck!
@@PatrickBateman12420 thank you for your advice sir, as a beginner, I need some more guidance.. How much tableau prep knowledge, because there is not much resources, can you share the link to learn, it will be helpful..
@@sumitbarua9121 Hard to say in your case. I've been a full-time Tableau-only freelancer for 5 years in Germany. In general, the requirements for Tableau Prep are quite basic (pivots, unions, filter, output flow ...). My advice: learn only the basics - most work is done on the Desktop. If it gets advanced, your basic skills will be enough to understand the problem at hoc. A great book: GETTING UP AND RUNNING WITH TABLEAU PREP. PS: investing time and effort in Prep/ETL is worth it, I think. We understand the data much better and Prep is fun! Really.
Well explained..have a question I have a requirement in my project to show different color for the part of the bar that met the goal and past the goal amount.say 100 is goal and current value is 150. Till 100 one color and from 100-150 different color. Can we achieve this if yes could you please provide steps to accomplish it..thanks in advance.


You're a fantastic teacher; the Tableau community is fortunate to have an advocate that is both knowledgeable and able to convey functional topics in a complete and a concise manner. Rock-star extraordinaire.
Thank you Don, I appreciate your kind note and support. I am glad you found the video helpful!
Bingo! You have hit the bull's eye, with the "bullet" in this Bullet Chart tutorial! Thanks Donabel for yet another comprehensive video covering an important chart type! Waiting for more!
Love the history of the viz. It gives so much more context. AWESOME! Thank you for sharing.
Thank you Franco!
Hello Belle! You are back! Thank you so much for creating such a good channel for us who are just started to learn Tableau! Been learning a lot from your video!
Thank you so much for the nice note Yi! I appreciate it :) Happy to hear you are finding the videos helpful!
glad to see your back! I am still wondering when you would post new videos! Thank you so much!
Thank you Jiahua! I appreciate your note :) Hoping to post more regularly soon!
Great Miss, thanks for the videos.
As Always!! Awesome job, and thanks for your efforts. I am hoping that we will see from you some tutorials about Gauge Chart and Radial Chart, I know there are several videos but the way that you are presenting is really simple with less confusion 🙂
Thank you for the share! It is very useful!
Thank you Min!
This channel is really useful. Thank you. I noticed that the database from tableau public has been modified and I'm unable to replicate the viz. It seems that the year = year[Gift Date] relation it's not working and I'm getting all the year values as null.
Is there any solution for that, or I'm just doing it wrong? If I change the referential integrity the null year disappear, but there is no data in the bars.
How did you edit the date in the data source? When I change the number format the date visually changes but the date is still in mm/dd/yyyy in the formula bar for those cells so when I transfer it to tableau it's still in that format and all the years become null in the worksheet.
thanks mam for this useful video
I have a general question.
How many years tableau sustain in a Indian software industry.
Some of my friends saying.. tableau scope is decreasing now.
Please suggest me what to lean in data visualization.
Thanks, nice work!
One question: how did you add horizontal whitespace between the row bands? Are those just thick white row grid lines? I did that but even the thickest lines result in less spacing than I'd like to have...
Also one remark: the downloadable .twbx uses different row banding (50/80/100) than what you propose in this video (50/75/100).
Can you make a video on Guage charts. I'm not able to follow any videos.
Truly helpful..Thanks
Thank you Shailendra!
Thank you, mam, you solve every business case scenario...
Mam, I have one request how much SQL & ETL (Tableau Prep) is needed for the data analyst to cover because in the corporate company this is the major requirement.
Can you create one video for this, or create playlist for SQL.
As a new in this field, this will help many newbies like me.
Please reply mam.
Thank you for the suggestion Sumit. I will definitely try to create more videos on the data engineering/ETL side.
@@sqlbelle Thank you, mam. The quality teaching you give us is like a blessing to us.
Take my advice with a pinch of salt; I've been a full-time Tableau developer in Germany for 5 years. In Tableau jobs, you rarely need raw SQL (e.g., SELECT FROM ...). Raw SQL is overrated, in my view. However, you need to understand databases (joins, referential integrity, partion, granularity...). In short, lean the basics of raw SQL and do learn as much Tableau as you can (Tableau Prep, Tableau Desktop, & Tableau Server [not admin, but publishing, architecture, publishing data sources, Prep Conductor...]). Good luck!
@@PatrickBateman12420 thank you for your advice sir, as a beginner, I need some more guidance..
How much tableau prep knowledge, because there is not much resources, can you share the link to learn, it will be helpful..
@@sumitbarua9121 Hard to say in your case. I've been a full-time Tableau-only freelancer for 5 years in Germany. In general, the requirements for Tableau Prep are quite basic (pivots, unions, filter, output flow ...). My advice: learn only the basics - most work is done on the Desktop. If it gets advanced, your basic skills will be enough to understand the problem at hoc. A great book: GETTING UP AND RUNNING WITH TABLEAU PREP.
PS: investing time and effort in Prep/ETL is worth it, I think. We understand the data much better and Prep is fun! Really.
Well explained..have a question I have a requirement in my project to show different color for the part of the bar that met the goal and past the goal amount.say 100 is goal and current value is 150. Till 100 one color and from 100-150 different color. Can we achieve this if yes could you please provide steps to accomplish it..thanks in advance.
😍loved it.
I liked the thumbnail👍
Thank you.
Very clear
Thank you Kelvin!
Hi madam...how is career in tableau... I am from india... Is USA and canada better for tableau jobs?
Thanks Sivudu. I think it will depend on the industry as well, but I do see it often as either a must-have or good-to-have in certain postings.
Thanks!
Thank you so much Tammam!
it will be great if you provide a same dataset for the practice along with the video.
The Tableau Public workbook link is attached. Thus, the data can be downloaded.
𝙥𝙧𝙤𝙢𝙤𝙨𝙢
To busy of a chart
Thanks for the feedback