Bar Graph for Group Differences in SPSS - Graphing Categorical Variables (4-9)

Вставка
- Опубліковано 9 лют 2025
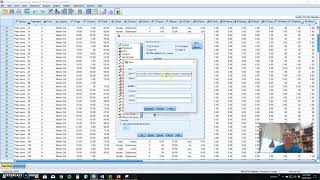
- We are going to plot a bar chart with error bars for independent measures using the Chart Builder. Then we can compare the error bars to see whether they overlap. When the error bars overlap, that suggests that the groups are actually very similar even if one bar is somewhat higher than the other. But when the error bars do not overlap, that suggests that the group means are probably different. This example uses Clickers.sav.
This video teaches the following concepts and techniques:
SPSS Chart Builder
Bar graphs with independent groups
Daniel, T., & Tivener, K. (2016). Effects of sharing clickers in an active learning environment. Educational Technology & Society, 19 (3), 260-268. Retrieved from www.j-ets.net/...
Link to a Google Drive folder with all of the files that I use in the videos including the Bear Handout and the Clickers.sav dataset. As I add new files, they will appear here, as well.
drive.google.c...


The dependent variable here (preference score) is ordinal, are we allowed to use means for ordinal variables?!
Poor choice of video title. The video title states bar grpah for group difference instead you are simply teaching how to design a bar graph with error bars. I saw the whole video and you did not taught how to "graphically represent" bar group difference on a bar graph.
Yeah, that one needs to be updated. Thanks for the head's up...I'll add that to my "to do" list for the next iteration.