Nice but wondering any playlist to create such beautiful dashboard as I need to create a performance ranking chart (to see their grading A vs Last year B) and also the photos of each employee
Can we have a map tutorial on power bi? I’ve been trying to add coordinates but they are not matching despite following multiple forums and their instructions
Very nice video. I have one requirement, I want to disable the slicer (grayed out), but still show values related to what selected in 1st slicer...just to know what values are available...is it possible...if so please make video.
You can't disable slicers. If you don't want the "clicks" to interact with the report, here are two options: 1) Instead of a slicer, use a card and list all the available options in the card via a dax measure like CONCATENATEX 2) Keep the slicer, but disable interactions with everything on the report (by using the edit interactions button)
Correction: You can use either selectedvalue() or isfiltered() to see if the column (or table) has a filter and then pass it visual filter for second slicer to disable it. This will "disable" the whole thing, so no values will be shown either. Refer to Bas's video for an example - ua-cam.com/video/FoEnJ35yG8g/v-deo.html
Chandoo Sir Arranging weekdays and months in chronological order is very difficult watched many videos it is showing as other columns are depended pls help us only you can save us 😅😢


Awesome, just clear, +ve and simple explanation. Thank you!! ❤
Awesome thank you! I’ve got 2 tables with the same application but one has more selection than the other. I’ll surely be using this! 😊
Oh this is wonderful. I can make my tables bigger with this because right now the slicers are either too tightly fitted in the report
Thank you Chandoo!. This is just what I was looking for
Good stuff.., didn't know that 'data' option was available in bookmarks..
Awesome Chandoo!
Waw man this is what I was looking for❤
Nice but wondering any playlist to create such beautiful dashboard as I need to create a performance ranking chart (to see their grading A vs Last year B) and also the photos of each employee
Thanks Chandoo. This is definately gonna help. 😊
For carousel type visualizations, you can use bookmarks.
Can we have a map tutorial on power bi? I’ve been trying to add coordinates but they are not matching despite following multiple forums and their instructions
Very nice video.
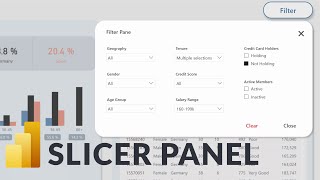
I have one requirement, I want to disable the slicer (grayed out), but still show values related to what selected in 1st slicer...just to know what values are available...is it possible...if so please make video.
You can't disable slicers. If you don't want the "clicks" to interact with the report, here are two options:
1) Instead of a slicer, use a card and list all the available options in the card via a dax measure like CONCATENATEX
2) Keep the slicer, but disable interactions with everything on the report (by using the edit interactions button)
Correction: You can use either selectedvalue() or isfiltered() to see if the column (or table) has a filter and then pass it visual filter for second slicer to disable it. This will "disable" the whole thing, so no values will be shown either. Refer to Bas's video for an example - ua-cam.com/video/FoEnJ35yG8g/v-deo.html
Gold! 🫵
Hi,
how is it possible to copy whole slicer panel with full functionality on most of the pages of one report?
Thanks in advance
Dusan
Really.. how awesome is this... thanks for sharing...
My pleasure 😊
@chandoo, hello sir may I know which playlist of yours is recommended for DA excel which has all the topics covered
Please put videos on how to handle the error on uploading files
Mr Chandoo , how to create image slicer in power bi
Awesome
Hi Chandu,
The search bar in the slicer became case sensitive 😢.
How to remove the case sensitivity 🎉
Create the Finance Dashboard and add Navigation, Cards, Charts, Link to the Website and Slicer (Using Finance Dataset)
AWESOME
Awesome
❤
Can you share the pbix file?
Chandoo Sir Arranging weekdays and months in chronological order is very difficult watched many videos it is showing as other columns are depended pls help us only you can save us 😅😢
❤