🎯 Key Takeaways for quick navigation: Hypothesis testing for correlational design involves identifying alternate and null hypotheses. Non-directional tests are typically used and are more conservative in statistics. The null hypothesis states there is no relationship between variables being tested. Descriptive statistics summarize the data before performing a correlation test. Using regression in Excel can provide a correlation value and test of significance. A p-value of less than or equal to 0.05 indicates statistical significance. A statistically significant result means rejecting the null hypothesis. In the example given, there was a statistically significant relationship between stress and physical symptoms. Made with HARPA AI
🎯 Key Takeaways for quick navigation: Hypothesis testing for correlational design involves identifying alternate and null hypotheses. Non-directional tests are more conservative in statistics. Null hypothesis states the absence of a relationship between variables. Pearson's correlation value shows the relationship, but p-value determines statistical significance. In hypothesis testing, a p-value less than or equal to 0.05 indicates statistical significance. A p-value of 0.02 suggests a statistically significant relationship between stress and physical symptoms. Made with HARPA AI
Hi Sir, i need your help. From below info, what you understand. Can you explain to me, pls? Hypothesis i) There is a positive relationship between salary and employee retention - BETA VALUE (-0.379), Pearson Correlation (-0.289) Result : Accepted ii) There is a positive relationship between communication and employee retention - BETA Value (-0.159), Pearson Correlation (0.110), Result (Accepted) iii) There is a positive relationship between job satisfaction and employee retention which impact their decision to stay : BETA Value (-0.115), Pearson Correlation (-0.136), Result (Rejected)
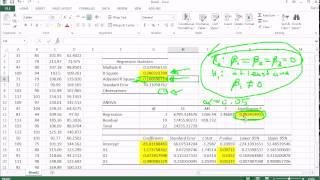
Thank you so much for this clear explanation, in my results, Regression stat Multiple R +0.470211196, while the correl = - 0.47021196, what is this mean or is it OK?
Without going into the details of why, multiple R is always positive. The sign of the correlation is what will tell you the direction of the relationship accurately. You will also note that the sign of the slope in the regression table will match the sign of the correlation coefficient.
No, the alternate hypothesis cannot contain a statement of equality in classical, frequentist hypothesis testing. Saying "no relationship" is the null (null means "none" basically), and it contains the statement of equality (such as r = 0) in the context of the correlation between two variables. The alternate is that there is a relationship of some kind.
If the p value is 0.08 and you set alpha at 0.05 (or are using this as the "conventional" alpha), you would retain the null hypothesis because 0.08 > 0.05 (i.e., p > alpha). Your obtained p value must be less than or equal to alpha to reject the null hypothesis.
For correlation, you select both X and Y (there is only one input box). Excel will expect that one column contains X and one contains Y. When you do regression, you have to select X and then select Y (and there are input boxes that identify which one to put where ("Y Input Range" and "X Input Range").
In classical hypothesis testing using "frequentist" approaches, the "null" is the assumption we make to start. The "null" is generally going to be a statement of "no effect" -- null means "having or associated with the value zero". Unless there is some context given that makes it clear that the null hypothesis should be a value other than 0 based on some knowledge regarding the assumptions being made about the population, the assumption in correlation (or regression) is that the null hypothesis expects there to be "no relationship" (i.e., the correlation [or slope] coefficient is 0). The "alternative" (or research) hypothesis is the one that expects a relationship. Given the correlation coefficient is the numeric representation of the "relationship" between the two variables, the alternative would therefore mean that mathematically the correlation coefficient does not equal 0 (as a non-directional hypothesis example). If you have a reason to expect a particular type of relationship (positive or negative), you might be more specific and say that the correlation coefficient is "greater than" or "less than" zero, but this would only be if you are making a directional hypothesis. (The default in most "real-world" applications is to use non-directional hypotheses, but some classes or books will have you practice with directional ones, too.)
You can, but Likert scale data is technically ordinal which is not perfectly in line with the assumptions of Pearson's correlation. As such, a more "technically correct" approach would be to use Spearman's rho for testing correlation in this case -- shown here: ua-cam.com/video/K2QMKnA3jXQ/v-deo.html. That said, the two methods will generally yield similar results and, in practice, it is rather common to treat Likert scale data "as if" it were interval-ratio data in many disciplines that use applied statistics.
You can do it one by one if what you want to know is the "bivariate correlation" of each independent variable with the dependent variable. If you want to know how all three variables relate to the outcome "controlling for the others," you would want to use a multiple independent variable approach. The simplest way to do this in Excel is to use regression and select the multiple independent variables all at once. Which approach to use (3 bivariate correlations or 1 multiple regression) depends mostly on your question. For example, if you want to know whether one variable "adds" to your ability to predict the dependent variable above and beyond the others, you would want to use a multiple regression. If you just want to know whether each variable is related to the dependent variable in its own, you would use several bivariate correlations. Hope that helps!


This gets crazy so quickly 😭😭
🎯 Key Takeaways for quick navigation:
Hypothesis testing for correlational design involves identifying alternate and null hypotheses.
Non-directional tests are typically used and are more conservative in statistics.
The null hypothesis states there is no relationship between variables being tested.
Descriptive statistics summarize the data before performing a correlation test.
Using regression in Excel can provide a correlation value and test of significance.
A p-value of less than or equal to 0.05 indicates statistical significance.
A statistically significant result means rejecting the null hypothesis.
In the example given, there was a statistically significant relationship between stress and physical symptoms.
Made with HARPA AI
🎯 Key Takeaways for quick navigation:
Hypothesis testing for correlational design involves identifying alternate and null hypotheses.
Non-directional tests are more conservative in statistics.
Null hypothesis states the absence of a relationship between variables.
Pearson's correlation value shows the relationship, but p-value determines statistical significance.
In hypothesis testing, a p-value less than or equal to 0.05 indicates statistical significance.
A p-value of 0.02 suggests a statistically significant relationship between stress and physical symptoms.
Made with HARPA AI
AI...a great example of the usefulness of statistical models
Hi Sir, i need your help. From below info, what you understand. Can you explain to me, pls?
Hypothesis
i) There is a positive relationship between salary and employee retention - BETA VALUE (-0.379), Pearson Correlation (-0.289) Result : Accepted
ii) There is a positive relationship between communication and employee retention - BETA Value (-0.159), Pearson Correlation (0.110), Result (Accepted)
iii) There is a positive relationship between job satisfaction and employee retention which
impact their decision to stay : BETA Value (-0.115), Pearson Correlation (-0.136), Result (Rejected)
thankyou
Man I need help for my dissertation could you give me a few hints? I’d pay you honestly
Thank you!
Thank you so much
Thank you so much for this clear explanation, in my results, Regression stat Multiple R +0.470211196, while the correl = - 0.47021196, what is this mean or is it OK?
Without going into the details of why, multiple R is always positive. The sign of the correlation is what will tell you the direction of the relationship accurately. You will also note that the sign of the slope in the regression table will match the sign of the correlation coefficient.
Thank you 😊
Thank you so much !
Is n't the alternate hypothesis quite the opposite that there is no significant relation between 2 variables , thats why the name is alternate
No, the alternate hypothesis cannot contain a statement of equality in classical, frequentist hypothesis testing. Saying "no relationship" is the null (null means "none" basically), and it contains the statement of equality (such as r = 0) in the context of the correlation between two variables. The alternate is that there is a relationship of some kind.
Thank u so much sir
what if the p value is up to 0.08****, what do we accept and reject then??
If the p value is 0.08 and you set alpha at 0.05 (or are using this as the "conventional" alpha), you would retain the null hypothesis because 0.08 > 0.05 (i.e., p > alpha). Your obtained p value must be less than or equal to alpha to reject the null hypothesis.
@@cavanliew thank you so much for the quick reply. You really really helped me for my last minute study for stats exam that's in a couple of hours
What did you insert to the data analysis? The X or Y? Or both?, Nah, I got it
For correlation, you select both X and Y (there is only one input box). Excel will expect that one column contains X and one contains Y. When you do regression, you have to select X and then select Y (and there are input boxes that identify which one to put where ("Y Input Range" and "X Input Range").
@@cavanliew thank you
Last how did u decided its null or alternative??
In classical hypothesis testing using "frequentist" approaches, the "null" is the assumption we make to start. The "null" is generally going to be a statement of "no effect" -- null means "having or associated with the value zero". Unless there is some context given that makes it clear that the null hypothesis should be a value other than 0 based on some knowledge regarding the assumptions being made about the population, the assumption in correlation (or regression) is that the null hypothesis expects there to be "no relationship" (i.e., the correlation [or slope] coefficient is 0). The "alternative" (or research) hypothesis is the one that expects a relationship. Given the correlation coefficient is the numeric representation of the "relationship" between the two variables, the alternative would therefore mean that mathematically the correlation coefficient does not equal 0 (as a non-directional hypothesis example). If you have a reason to expect a particular type of relationship (positive or negative), you might be more specific and say that the correlation coefficient is "greater than" or "less than" zero, but this would only be if you are making a directional hypothesis. (The default in most "real-world" applications is to use non-directional hypotheses, but some classes or books will have you practice with directional ones, too.)
Can I use the same method for Likert Scale Data?
You can, but Likert scale data is technically ordinal which is not perfectly in line with the assumptions of Pearson's correlation. As such, a more "technically correct" approach would be to use Spearman's rho for testing correlation in this case -- shown here: ua-cam.com/video/K2QMKnA3jXQ/v-deo.html. That said, the two methods will generally yield similar results and, in practice, it is rather common to treat Likert scale data "as if" it were interval-ratio data in many disciplines that use applied statistics.
Hello sir, what if there’s 3 indpendent variable i want to correlate it with the dependent variable? How sir? Or should i do it one by one?
You can do it one by one if what you want to know is the "bivariate correlation" of each independent variable with the dependent variable. If you want to know how all three variables relate to the outcome "controlling for the others," you would want to use a multiple independent variable approach. The simplest way to do this in Excel is to use regression and select the multiple independent variables all at once. Which approach to use (3 bivariate correlations or 1 multiple regression) depends mostly on your question. For example, if you want to know whether one variable "adds" to your ability to predict the dependent variable above and beyond the others, you would want to use a multiple regression. If you just want to know whether each variable is related to the dependent variable in its own, you would use several bivariate correlations. Hope that helps!
@@charlesvanliew9927 thank you so much sir for your response and great answer! It helps me a lot 😊
May I ask why regression?