Txy and Pxy Diagrams in Aspen HYSYS

Вставка
- Опубліковано 19 жов 2022
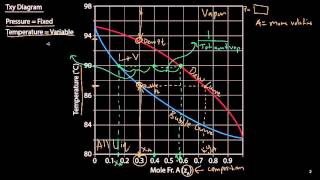
- This video tutorial explains how to develop temperature-composition (xy) and pressure-composition (xy) diagrams in Aspen HYSYS. The start of the video explains how changing the temperature and pressure affects the molar compositions of vapor and liquid in a vapor-liquid equilibrium system.
Here is the link to how to draw a xy diagram in Aspen HYSYS • Vapor Liquid Equilibri... - Наука та технологія


Simply Excellent ❣❣❣❣❣💖
I don't know why, but when i try to do the Txy or Pxy Diagrams it dosen't work. Aspen dosen't show me anything.
Most likely, you are missing adding components or missing entering properties. Watch from 11:35 and ensure you follow the steps.
Hello
I have a plot pxy diagram (5curves)
and I want to analyze it..
So can you help me?
Please email me, and I will see if I can help.
@@drzamansajid
Where is your email?
@@user-sy1gz9ws5g zaman.sajid@mun.ca
@@drzamansajid
Do you receive ?
I sent it
@@user-sy1gz9ws5g No