Noise Source and Noise Measurement Basics

Вставка
- Опубліковано 22 сер 2024
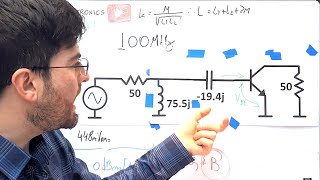
- Gregory covers the essentials of Noise Sources and Measurements, focusing on the use of a BJT transistor as a noise source. The BJT is configured with a reversed bias at its base-emitter junction, followed by a series of common-emitter amplifiers.
To analyze the noise at the circuit output, Gregory employs a Spectrum Analyzer with a noise marker function. This data is then used to estimate the BJT Excess Noise Ratio (ENR), factoring in the noise floor and amplification gain slope of the measurement setup.
The results are presented as Noise Power Densities and Noise Temperatures, chosen for their convenience in respective calculations. This approach allows for a straightforward yet thorough exploration of the noise characteristics.
BJT PN Junction Noise Source
gusbertianalog...
Video about Noise Temperature and SNR
• Signal to Noise Ratio,...
This video was made possible by Patreon support:
/ allelectronics
00:42 - Circuit overview
01:32 - Motivation for the measurements
02:54 - Noise characteristics
04:14 - Noise Power Density
05:48 - Reverse-biased base-emitter junction
06:46 - Spectrum analyzer measurement
08:08 - RBW and noise marker
11:24 - Automated measurements
14:54 - Amplifier gain de-embedding
17:10 - Excess noise ratio ENR
19:00 - Spectrum analyzer noise floor correction
23:04 - Circuit description
26:04 - Noise from Zener effect and Avalanche Breakdown


Support channel becoming a Patron www.patreon.com/allelectronics
Do you never read messages on Patreon ?
Thanks for your videos, I don't speak English but I watch your videos with subtitles :)
😝😝🙏🏼🙏🏼
The practical use of this circuit is to synthesize the sound of a chinbal from an electronic drum from the 70s. very good video.. merry Christmas
🤣🪘🪘
Many thanks!
Great Video and Great Explanation. Thank you.
Glad you liked!
Thank you Eng. Greg! I had learned a lot with you video !!! I am Brazilian Electronic.
Glad to hear that!
Hello my friend! I really appreciate your UA-cam Channel, your content is amazing! I'm learning a lot!
User should be careful to ALWAYS put a bandpass filter between the noise source outpur and the spectrum analyzer inout to prevent overloading the input power . Usually between 10dbm 20dbm is safe however without bandpass filter, the noisegen will send that power over a wide range of frequency which according to parseval theorem, the totatl power will increase with an rms behaviour which can easily exceed 20 dbm
Great point, will add this to the article! Thanks man.
@@AllElectronicsChannel thank you! Your videos are so high quality and comprehensive that finding a small missing thing is like a miracle. The whiteboard component in your video is such a phenomenal tool 🔥 cheers
I think you are talking about an attenuator - not band pass filter.😊
@@InssiAjatonif one wants to find Sij over a smaller frequency range say 200mhz to 250mhz, then a band pass filter is more advantages because you can have better dynamic range. The NS already generates a +5db over that smaller interval so the parseval power density is not gonna be much higher than 10dbm over that short interval. so we are set with a huge dynamic range from 10 dmb to whatever SA can go down ...An attenuator will dampen the amp over the whole huge range thus reduces the dynamic range which can be improved with anotger amplification stage which is not very necessary in this case. But I agree if someone wants to be totally safe, he would put a 40dbm att at the first try and theb plays with the amount of attenuation to increase the dynamic range
@@arashghasemi Our thinking is really based on different experiences. Mine is to meet the noise limits in industrial controllers, conducted and/or radiated. For the conducted (generally switching) noise, we have to measure 9 kHz to 30 MHz band, using a Line Impedance Standardizing Network device. The line in question can be single, or 3 phase. In US, that can mean 115 V RMS or 480 to 520 V RMS nominal applied to the LISN. The construction of the LISN is such that in continuous use you get a 50 ohm signal of the 9 kHz to 30 MHz band of interest signal at a safe level. But when hooking up the LISN to the spectrum analyzer, you may get a destructive transient. Ask, how I know… Anyway, you just have to use an attenuator for that time protection. And you don’t need to worry about pressing more dynamic range, as the purpose is that the emitted noise stays below roughly -50 dBm, quasi RMS. Or another 10 dB safety margin, if you don’t have the quasi RMS processor and you are making your own preliminary measurements before submitting the devise to official test by an agency who has the fancier equipment. So, checking an intentional noise generator that operates maybe at millivolts, you only need the protection against STATIC CHARGE, and can likely achieve that in other ways. For my power line voltage LISN, you ideally would need a clamp, but for practical reasons, a 30 - 40 dB attenuator is the standard safety measure.
Nice one, I made a noise source recently using a R2M avalanche diode with a boost converter, the noise is definitely better, I used 2n5484 jfets in cascode configurations for a 100mhz flat bandwidth, Love your videos man.
Sounds great! Something we could replicate in the future, thanks man!
Outstanding analysis!
Thanks man! 😁😁
If you look certain transistor noise curves by the manufacturers (generally provided only for LOW NPOISE parts) you probably notice that they present the graphs on a logarithmic frequency scale (x-axis). You show a linear scale. which changes the apparent curve shape. If I recall, the ‘815 spectrum analyzer can produce its result on logarithmic, as well as linear scale.
.
Another little note is that your supply voltage is rather low for approximating constant current. If the voltage would be raised to, say 24 V, you would be considerably closer to constant current feed (on a 5 V reverse bias junction. By the way, if you would use ordinary diodes, they generally have much higher reverse voltages and operate in Avalanche mode, rather than in transition between zener and avalanche. But there is a change in both noise amplitude and noise spectrum - the first one becoming higher, while the spectrum gets narrower.
.
Finally, if you would limit the issue of noise to audio range (
Thank you so much for the info, man. This is exactly what I expected from the All Electronics community... I always learn with you, we are always learning together.
Great video, Gregory, as always! 😉
Glad you enjoyed it!
Digging the channel Gregory. Especially enjoyed the PLL!
Hahaha nice!!
Thanks, Gregory 👍
🍸🍸
thank you for the video
BAT17 schottky diode can also serve as a good noise diode source too. Also a UHF transistor like 2SC3356 or BFR92 works ok too.
Thanks man!
Hey Gregory, excelent video. Congratulations. I need your help! You've talked about a "blow filter" in a old video. Where can I found that content?
Интересные выводы, спасибо!
Awesome 👍
Thank you! Cheers!
much better audio!❤👍
Good to know!
Thank you Gregory!!!
🙏🏼🙏🏼🙏🏼
Suggestion to present in one video: Increase the temperature and observe the power generated using the formula N=kBT (where k is the Boltzmann constant, and B*T represents Bandwidth * Temperature).
And try predict bandwidth urs noise source that u made it. by : B=N/(k*T)
Awesome video! Learnt alot
Glad you enjoyed it!
Very interesting and well explained as a professor!! I would ask you the behaviour of the two stages following the noise source: I can see a higher gain at low frequencies and a lower gain at higher frequencies as expected (due to Ft of every BJT)but these devices can add their noise (F) which is 1/f noise as well! Now, how much of 1/f noise is included in the "1/f" gain curve/noise output of the stages?
Thanks,
Andrea
Great suggestion!
Great video. I have a question. How to measure the Noise Figure of a Mixer? any guidance? Thanks.
Thanks. The NF of a mixer is just a little higher than its conversion loss.. For calculation is common to use the conversion loss as the NF, for normal temperature use. For measurement, I think you should measure it with an LO equal to the LO that will be used in the application - measuring the noise at the IF. (or in reverse for up conversion applications).
8:49 nice explanations l. Would love to learn where you found those clear (and wide) parts drawers!
Bought many years ago... they are branded as Magus.
Thanks!...I don't seem to find them on the internet but I'll keep looking.@@AllElectronicsChannel
Gregory, excellent content. Thank you.
Question, your prototype board traces almost look like some kind of copper tape. Do you etch them or do u have some type of sticky copper trace?
These are etched!
Hi, my friend. Do you still have the hotmart courses for sale?
Very interesting topic to study and to play with. One thing I was asking myself. The noise source and noise of the spectrum analyzer add, but not in a arithmetic way, but rather like square root of quadratic summation that is used for adding up random sources of error? So the part you 'just' subtract the noise floor would also not be completely right. But maybe I am 'splitting hairs' here 😀and is your approach probably usable. Again, interesting video 👍
...and probably interesting way to test / characterize systems (like filters) when you do not have a high enough frequency test source. Other would be a very fast rising edge test signal.
Hey man! The temperatures adds, because they are a measure of noise power. If we were talking about noise voltages, indeed it you add as as a vector.
Nice video! A quick question: why are you using the markers to read out the spectrum? Should it not be much quicker to read out the power spectrum and normalize it to power density by hand afterward? Am I missing something?
No exact reason, totally possible to do as you suggested! One thing: correcting by 10 log (BW) may no be equal to what the SA do..it is possible it has a correction/calibration factor for each RBW filter...
Hello, how are you, you no longer have a course for sale at hotmart.
Nice
Hello Greg. Nice video.
What make of component drawers do you have? I see the little drawers are made of clear plastic which seem impossible to get these days.
I got it many years ago... it is a standard drawer, branded as Magus.
They are available on Amazon, and for industrial versions MSC.
Thanks !!
@@glasslinger Thank you. And I love your channel also.
Amazing. Вы из России?
Soooo crappy
Thanks for loving the channel 😝🤩🤩