Thanks Ali, watching your videos equates 10 year working for Goldman Sechs to learn so much from StatOasis UA-cam channel, I'm not suprised Vanguard ads on StatOasis videos
Thanks for the video, looks awesome! I have 2 questions to understand: 1. if I look at the S&P 500 from 2017 to today I would have made about 65% with an investment in an S&P 500 ETF. Following the strategy I just got 23% in 43 trades. Sure, I'm invested for a shorter time but in what way am I beating the base? 2. What do you think about using a turbo certificate with that strategy? Thanks a lot!
@@StatOasis I invested max. 2000 $ per Trade (so 4-5 Shares), what I could not simualte ist the reinvestment of the winnigs, I just invested 2000 $ max. But if this makes such a big difference? The best combination if found was RSI entry 25, exit 60, rsi length 4 2000 $ Capital, start 1.1.2018 Net Profit: 23,8 % Profit Factor: 82 % Drawdown: -574 $ / -30% Avg. earnings per Trade: 0,85% Is CFD a good idea following this strategy? Would be a way to increase initial capital...
you need to use all account to buy maximum number of shares on every trade. CFD is a broker derivative, so you will lose more in slippage and commission to the broker. CFD can't be transferred and they are not guaranteed by the exchange. if you have to use it, then pick a reputable broker.
just click on "add first condition" search for RSI and add it click on ">" sign and choose "crosses below" you need to practice, I have a beginner series that would be great help ua-cam.com/play/PLK373MfIF_TZlT9WxlxjMpHOCBl9ozUt3.html
@@StatOasis Thanks, Ali ! for your instruction; I have learned many things from your youtube videos!! I have registered a waiting list for the ALGO MasterClass. Thanks
It’s been a while since I produced this video. If u mean the starting capital it’s usually $10k in SQX and $100k in TradeStation/Multicharts If u r talking about system avg trade then whatever was in the video that’s it as it has nothing to do with starting capital
Hi Oasls, Thanks for your great content I just reaching out to you I one of Strategy Quant member I have my own portfolio but I really need your help how to build my strategy How can I reach you?
@@StatOasis awesome, i'll try it out. Does this mainly only work with mean reverting assets? Was wondering if it could work on some FX Pairs. I dont have the testing system that you do, so I dont know the best way to test, aside from manually doing backtesting.
Great vid and strategy! Though in buy and hold, half the CAGR comes in the form of dividends reinvested therefore wouldn't the 28% exposure affect this?
depending on the trade date and holding period, you will get some of the dividends, but you are reinvesting all the account in the next trade so you get your compound effect. Any way you slice it you beat the index in returns and specially in drawdowns.
@@StatOasis As an investor, buy and hold would be more robust? Then wouldn't that be the way to go instead of prioritizing higher returns? Or would you do a percentage in buy and hold and the rsi strategy?
buy and hold is not robust at all, in fact timing has a huge effect on BH performance, if you invested money in 2000 in SP500 index, then it would have taken you13 years till you see a small profit and you would have to hold through two +50% drawdowns and this is not taking inflation into account. even a simple system of buy if Close > SMA200, sell if Close < SMA200 is much better than buy and hold. we have been lucky in the US where BH has worked for some time but that is not a guarantee and is not the norm globally, in fact Japan still in a drawdown since 1990. don't believe the media, test it yourself. I am also an investor, I highly encourage you to see my TAA video ua-cam.com/video/MgKW13dRmJQ/v-deo.html ua-cam.com/video/oY_Vo2XXgd4/v-deo.html
Thanks for sharing. The decision to buy or sell is determined by the RSI value at the end or start of the day. Although the RSI may exceed certain limits multiple times within a day, actions are taken solely based on the RSI value at the end or start of the day. Am I understanding the rules correctly?
there is a simple formula to determine if an instrument edge is in mean reverting or trend following or none in a certain timeframe (I teach that in my course). In general mature markets (heavy participation) are prone to noise (mean reverting) and relatively new markets (low participation) are more trend following.
@@StatOasis I’m not sure what you are waiting on, but if you were waiting on a large enough group to go thru a live class then maybe you should think about doing a video based self paced course with a live FB group.
Why do you people complicate everything ? Instead of showing your screen and stuff why not first explain the concept with a simple white paper and pen and then show your trading screen.
There are many ways to reach the same goal, but if most are producing knowledge this way its because most viewers want it that way, at the end more viewers is one of the prominent metrics for content creators
@@StatOasis Thank you! I am a novice and most of this is over my head. I wish i could build your strategy step by step on a piece of paper and then apply the same on the trading screen.
Is this system good for stocks as portfolio as well ? On some other index futures, the setup with price under its MA turns out to be better than above. Probably this system tends to fit long term sideway up, but not down or sideway down I guess. Thank you for sharing nice strategy and its parameter range !👍


Amazing results and clearly robust strategy. Love this video. Great content. Thanks Ali !
Thanks Ali, watching your videos equates 10 year working for Goldman Sechs to learn so much from StatOasis UA-cam channel, I'm not suprised Vanguard ads on StatOasis videos
Thank you for watching
Hi! You re great. Just your smiling face Is enough. Your message Is clear and very useful. Complimenti and thank thank you ! Dont stop!
Thank you so much for your kind words
Hi and congratulations. Really nice content. Attatch to your videos. Thank you very much
So nice of you
One of the best videos yet! Thanks Ali!
Wow, thanks!☺
So cool! Simple but robust strategy 💪 Thank Ali 🙏
Glad you liked it!
Amazing video, the rsi is so versatile
As Always, great content. Thanks!
What about the ES futures - as it mean reverting, it should fit as well, right?
And what about the intraday trades?
all valid questions, you are on the right track, but only testing can answer, so roll your sleeves and test 🙂
Thanks for the great video! With this RSI system, are we buying on the open of the next bar once we receive the signal to buy? Same with selling?
TS & MC engine calculate everything after bar is closed. So once the signal is confirmed then you will buy next bar at open.
Hi there!
What about adding some ADX into it e.g.
adx(14)>20
Thanks!
yes of course you can try all kind of filters, you are on the right track
Thanks for the video, looks awesome!
I have 2 questions to understand:
1. if I look at the S&P 500 from 2017 to today I would have made about 65% with an investment in an S&P 500 ETF.
Following the strategy I just got 23% in 43 trades.
Sure, I'm invested for a shorter time but in what way am I beating the base?
2. What do you think about using a turbo certificate with that strategy?
Thanks a lot!
How many shares did you buy in a trade, did you use the whole account?
What about your drawdown?
@@StatOasis I invested max. 2000 $ per Trade (so 4-5 Shares), what I could not simualte ist the reinvestment of the winnigs, I just invested 2000 $ max. But if this makes such a big difference?
The best combination if found was RSI entry 25, exit 60, rsi length 4
2000 $ Capital, start 1.1.2018
Net Profit: 23,8 %
Profit Factor: 82 %
Drawdown: -574 $ / -30%
Avg. earnings per Trade: 0,85%
Is CFD a good idea following this strategy? Would be a way to increase initial capital...
you need to use all account to buy maximum number of shares on every trade.
CFD is a broker derivative, so you will lose more in slippage and commission to the broker. CFD can't be transferred and they are not guaranteed by the exchange.
if you have to use it, then pick a reputable broker.
Thanks
My pleasure
Great stuff
Thank you for watching
I me new to algoWizerd SQX I've tried to do same by adding RSI(4}[0] Croosses below 30 but I can't do it can you pleas explain how to do it Thanks
just click on "add first condition" search for RSI and add it
click on ">" sign and choose "crosses below"
you need to practice, I have a beginner series that would be great help
ua-cam.com/play/PLK373MfIF_TZlT9WxlxjMpHOCBl9ozUt3.html
@@StatOasis Thanks, Ali ! for your instruction; I have learned many things from your youtube videos!! I have registered a waiting list for the ALGO MasterClass. Thanks
Great video. Could you please comment on the trade size in $ per trade. I see $10K in the configuration but the numbers look like $100K results. Tx
It’s been a while since I produced this video.
If u mean the starting capital it’s usually $10k in SQX and $100k in TradeStation/Multicharts
If u r talking about system avg trade then whatever was in the video that’s it as it has nothing to do with starting capital
@@StatOasis wow! Thanks for the quick reply. I was asking about how much $ per trade.
Whatever is showing in the video that’s it, but i doubt it’s $10k average trade
Hi Oasls,
Thanks for your great content
I just reaching out to you I one of Strategy Quant member I have my own portfolio but I really need your help how to build my strategy
How can I reach you?
Info at StatOasis dot com
Hello Oasis,the email you conden come through?
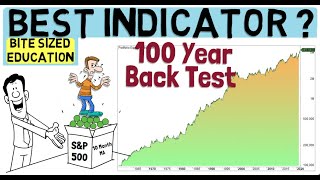
dang only 324 trades (with original settings) in 28 years?? thats like 1 trade a month. Great video
thanks for watching. with four systems at 55% correlation you get +1200 trades.
@@StatOasis awesome, i'll try it out. Does this mainly only work with mean reverting assets? Was wondering if it could work on some FX Pairs. I dont have the testing system that you do, so I dont know the best way to test, aside from manually doing backtesting.
only mean reverting assets, NZDCAD is a mean reverting currency
Great vid and strategy! Though in buy and hold, half the CAGR comes in the form of dividends reinvested therefore wouldn't the 28% exposure affect this?
depending on the trade date and holding period, you will get some of the dividends, but you are reinvesting all the account in the next trade so you get your compound effect. Any way you slice it you beat the index in returns and specially in drawdowns.
@@StatOasis As an investor, buy and hold would be more robust? Then wouldn't that be the way to go instead of prioritizing higher returns? Or would you do a percentage in buy and hold and the rsi strategy?
buy and hold is not robust at all, in fact timing has a huge effect on BH performance, if you invested money in 2000 in SP500 index, then it would have taken you13 years till you see a small profit and you would have to hold through two +50% drawdowns and this is not taking inflation into account.
even a simple system of buy if Close > SMA200, sell if Close < SMA200 is much better than buy and hold.
we have been lucky in the US where BH has worked for some time but that is not a guarantee and is not the norm globally, in fact Japan still in a drawdown since 1990.
don't believe the media, test it yourself.
I am also an investor, I highly encourage you to see my TAA video
ua-cam.com/video/MgKW13dRmJQ/v-deo.html
ua-cam.com/video/oY_Vo2XXgd4/v-deo.html
can u add a part in ur video where u show trade examples on the chart, thx a millie
If you have SQX you need to switch on that option, but unfortunately SQX chart is not the best option to visualize trades or indicators
Hi, per original strategy by L Connors, are all actions being taken by end of the trading day?
You can try both, either EOD or next day open, it will make a difference depending on market
Thanks for sharing. The decision to buy or sell is determined by the RSI value at the end or start of the day. Although the RSI may exceed certain limits multiple times within a day, actions are taken solely based on the RSI value at the end or start of the day. Am I understanding the rules correctly?
Cheers Ali. Have you tried this on any other instruments?
It will work on all equity indexes
You have said SPY/SP500 index is a mean reverting instrument. How do you determine if a given instrument is mean reverting?
there is a simple formula to determine if an instrument edge is in mean reverting or trend following or none in a certain timeframe (I teach that in my course).
In general mature markets (heavy participation) are prone to noise (mean reverting) and relatively new markets (low participation) are more trend following.
@@StatOasis If you would open your course then you could teach it. 😀
😂😂
@@StatOasis I’m not sure what you are waiting on, but if you were waiting on a large enough group to go thru a live class then maybe you should think about doing a video based self paced course with a live FB group.
@@jpcoder He's building an addon to sqx for regime and I'm sure he has enough interest for the course.
Why do you people complicate everything ? Instead of showing your screen and stuff why not first explain the concept with a simple white paper and pen and then show your trading screen.
There are many ways to reach the same goal, but if most are producing knowledge this way its because most viewers want it that way, at the end more viewers is one of the prominent metrics for content creators
@@StatOasis Thank you! I am a novice and most of this is over my head. I wish i could build your strategy step by step on a piece of paper and then apply the same on the trading screen.
I have no idea what the hell you are talking about.
😁 it is an algo strategy, multiple versions in a portfolio, watch again and it will click
Is this system good for stocks as portfolio as well ?
On some other index futures, the setup with price under its MA turns out to be better than above.
Probably this system tends to fit long term sideway up, but not down or sideway down I guess.
Thank you for sharing nice strategy and its parameter range !👍
you can use on many stocks with ranking